Unlock your genetic potential or gift the power of personalized health. Browse our Supersaver Packs now.
Did you know that humans were never meant to digest lactose? A mutation that appeared thousands of years ago allowed humans to digest lactose and has been passed down ever since. Today, 70% of the world remains lactose intolerant, experiencing extreme digestive discomfort from dairy. This article will explore the genes behind lactose intolerance, explaining where the mutation came from, how it works, and what you can eat with a lactose-intolerant gut.
Lactose intolerance occurs when lactose is not digested well by our digestive system due to reduced or non-production of lactase enzymes.
Lactose is a healthy carbohydrate commonly found in milk and milk products.
It consists of two sugar units: glucose and galactose.
Lactose improves the absorption of calcium, which is essential for bone health.
Lactase is the enzyme in our body that breaks down lactose.
A deficiency or defect in this enzyme would prevent lactose from being digested, leading to primary lactose intolerance.
Secondary lactose intolerance is due to an illness or an injury that affects your small intestine.
Celiac disease and Crohn’s disease are common diseases affecting the intestine and impacting lactase secretion.
When lactose-intolerant people consume dairy products, they usually experience unpleasant gastrointestinal symptoms.
Some of the symptoms that occur immediately include:
Yes, lactose intolerance is primarily influenced by genetics, which determines how much lactase, the enzyme responsible for digesting lactose, is produced in the body.
This condition can manifest in various forms, with primary lactose intolerance being the most common.
In this case, individuals typically produce sufficient lactase during infancy but experience a decline in lactase production as they age, leading to difficulties digesting dairy products.
Additionally, congenital lactose intolerance is a rare genetic disorder where infants are born without the ability to produce lactase at all.
Understanding these genetic factors helps explain the varying degrees of lactose intolerance across different populations and age groups.
The LCT gene produces the lactase enzyme, which degrades the lactose molecules.
Another gene on chromosome 2 called MCM6 controls the LCT gene.
One portion of this MCM6 gene, known as a regulatory element, helps control the amount of lactase the LCT gene can produce.
This RSID denotes a mutation in the MCM6 gene, which controls the amount of lactase produced.
The most common allele in this position is T.
It enables lactase production in proportion to the number of T alleles present.
A person with two T alleles (one from each parent) will produce more lactase than someone with one or no T alleles.
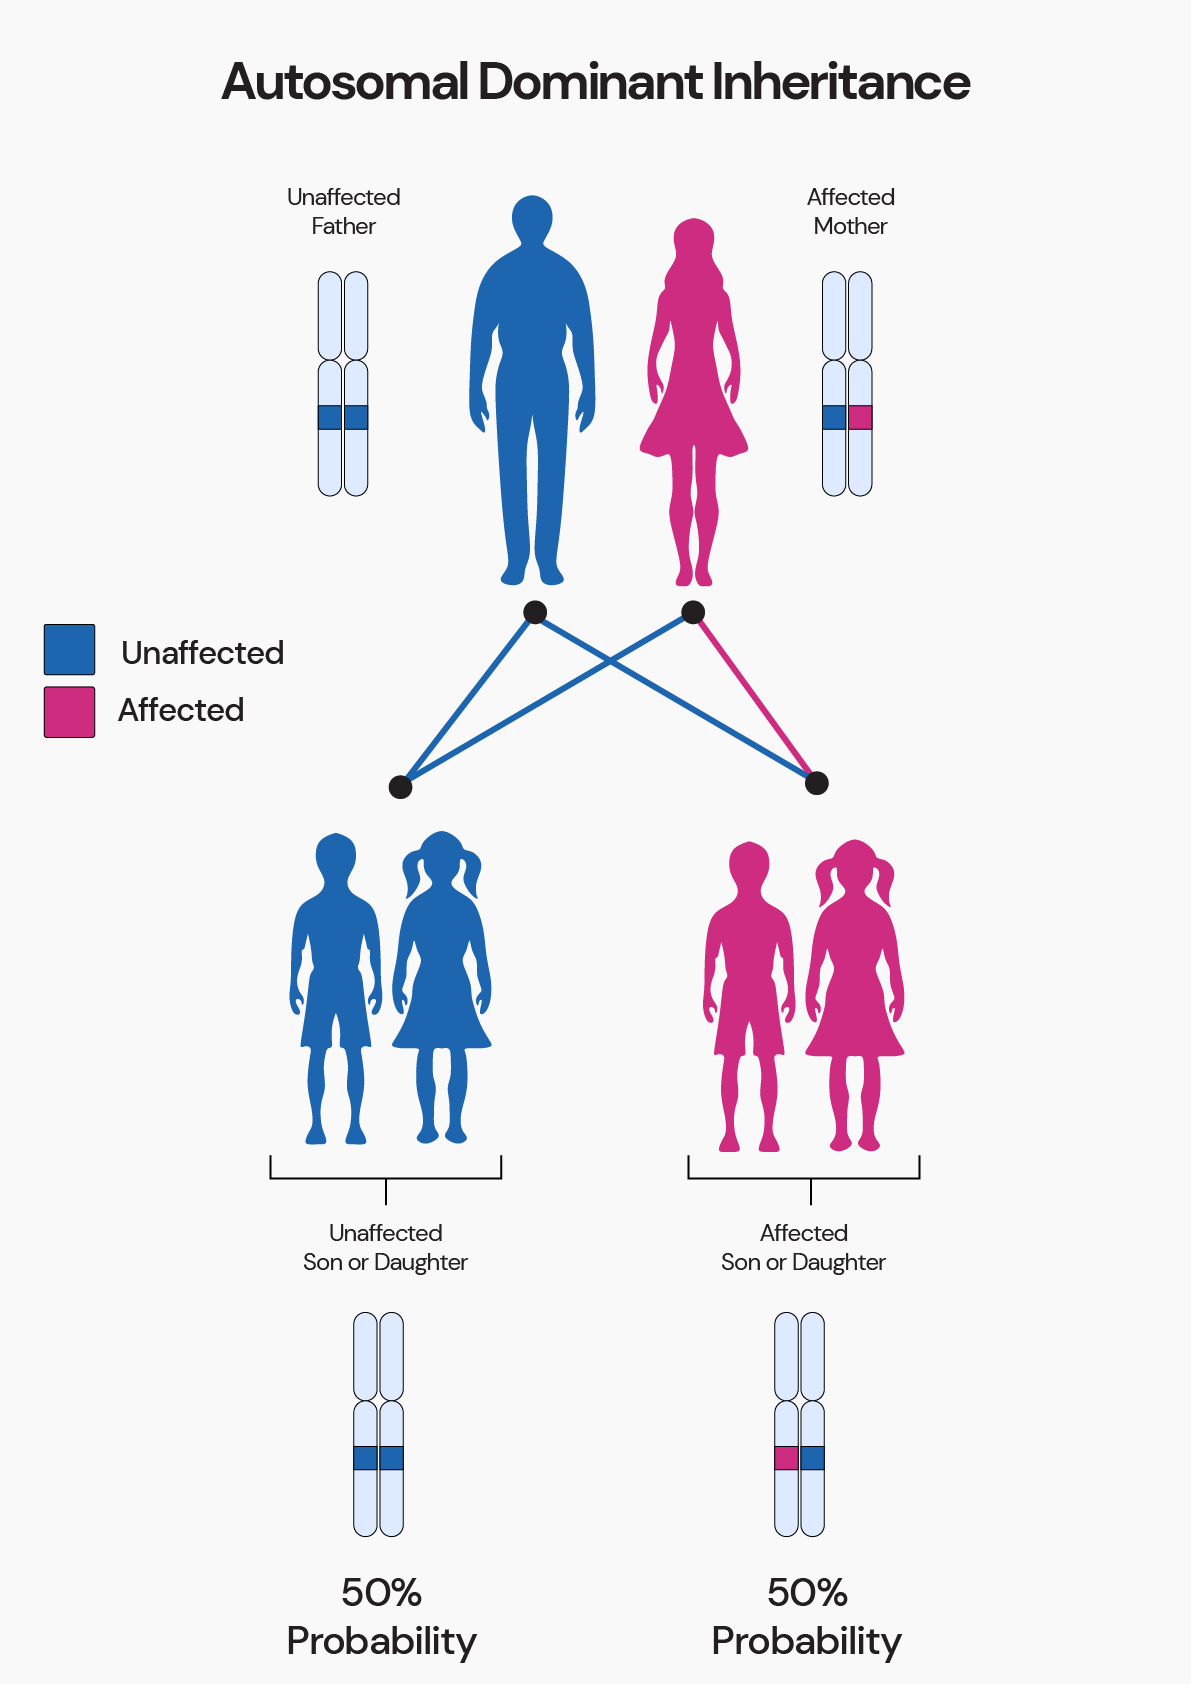
The lactose tolerance or persistence trait is inherited in an autosomal dominant pattern.
It means that if any of your parents are lactose tolerant, you will be too.
This dominant inheritance pattern helps explain how the trait spread far and wide over generations.
Lactose intolerance is inherited in an autosomal recessive manner.
This is why it’s prevalent within communities.
Animals can only digest milk in their infancy while their mothers nurse them.
As they grow, their bodies gradually stop producing lactase.
Thus, the entire animal kingdom, except humans, is naturally lactose intolerant.
Around 8,000 years ago in present-day Turkey, humans had just started to domesticate and milk cows, goats, and sheep.
The lactase gene LCT mutation appeared more frequently, imparting lactose tolerance to humans.
Initially, only a few humans had this mutation.
During times of famine, milk was the only nourishment readily available.
Those who could digest lactose survived and passed on the gene to their descendants.
Imagine a person who’s been following a vegan diet.
Since he doesn’t digest lactose, his body stops producing lactase.
The cells responsible for lactase production disappear temporarily due to disuse.
This explains why a genetic test could indicate intolerance despite no history of lactose intolerance.
If he consumes a dairy product, he will likely experience symptoms of lactose intolerance.
This is because the lactase-producing cells need to reactivate and proliferate.
Certain bacteria in our gut flourish in the presence of lactose and help break it down.
This is why many lactose-intolerant people can still have a cup of milk (12 grams of lactose) without experiencing any symptoms.
This could also explain why a person can consume dairy despite a genetic test indicating lactose intolerance.
The incidence of lactose intolerance varies among different population groups.
East Asians are the most lactose intolerant population, with 70-100% of people affected.
On the other hand, North Europeans have an incidence of 18-26%.
Their ancestors had a culture of dairy farms and consumed unfermented dairy products, passing on the gene type that produces lactase.
Ethnicity also influences the age of onset of lactose intolerance.
In Finland, 1 in 60,000 newborns are affected, the highest incidence in infants worldwide.
In African-American populations, most children develop intolerance by the age of two.
Caucasian children become intolerant after five years of age.
A lactose-free diet is the best way to combat lactose intolerance.
Before eliminating lactose from your diet, you should test the extent of your intolerance.
Research suggests that many people can have a cup of milk daily (12 grams of lactose) with barely any symptoms.
Lactose-digesting bacteria in your gut can sometimes substitute for lactase.
Some lactose intolerance therapies involve introducing new lactose-digesting bacteria into the gut.
Since dairy is rich in Vitamin D and calcium, it’s best to have a cup of milk if you can tolerate it.
But even if a hint of lactose in your diet puts you in trouble, you should eliminate dairy and all other sources of lactose.
Some healthy food groups that are also lactose-free include:
Calcium and vitamin D are essential for your bone health.
Getting adequate levels of these nutrients on a dairy-free diet can be challenging.
Some food sources are naturally high in calcium and vitamin D.
Incorporating these foods into your diet can keep your bones healthy:
Modify your diet only after consulting a doctor.
How It Works: Are Freckles Genetic?

Is Sleep Apnea Genetic? Risk Factors, Treatment, And More

Is Handedness Genetic? What Science Tells Us
https://evolution.berkeley.edu/evolibrary/news/070401_lactose
https://medlineplus.gov/genetics/gene/mcm6
https://www.snpedia.com/index.php/Rs4988235
https://www.ncbi.nlm.nih.gov/pmc/articles/PMC3048992
https://www.ncbi.nlm.nih.gov/pubmed/25625576?dopt=Abstract
https://link.springer.com/article/10.1007/s12602-018-9507-7
https://medlineplus.gov/genetics/condition/lactose-intolerance/#frequency
https://pubmed.ncbi.nlm.nih.gov/22643754
https://www.ncbi.nlm.nih.gov/pmc/articles/PMC2986166/
While researchers suspect a combination of genes and environmental factors that trigger lupus, there's still no light on which one in particular sets the disease in motion. This article attempts to explore the genetic side of lupus and explains why even though lupus isn't a hereditary condition it is still seen running in families.
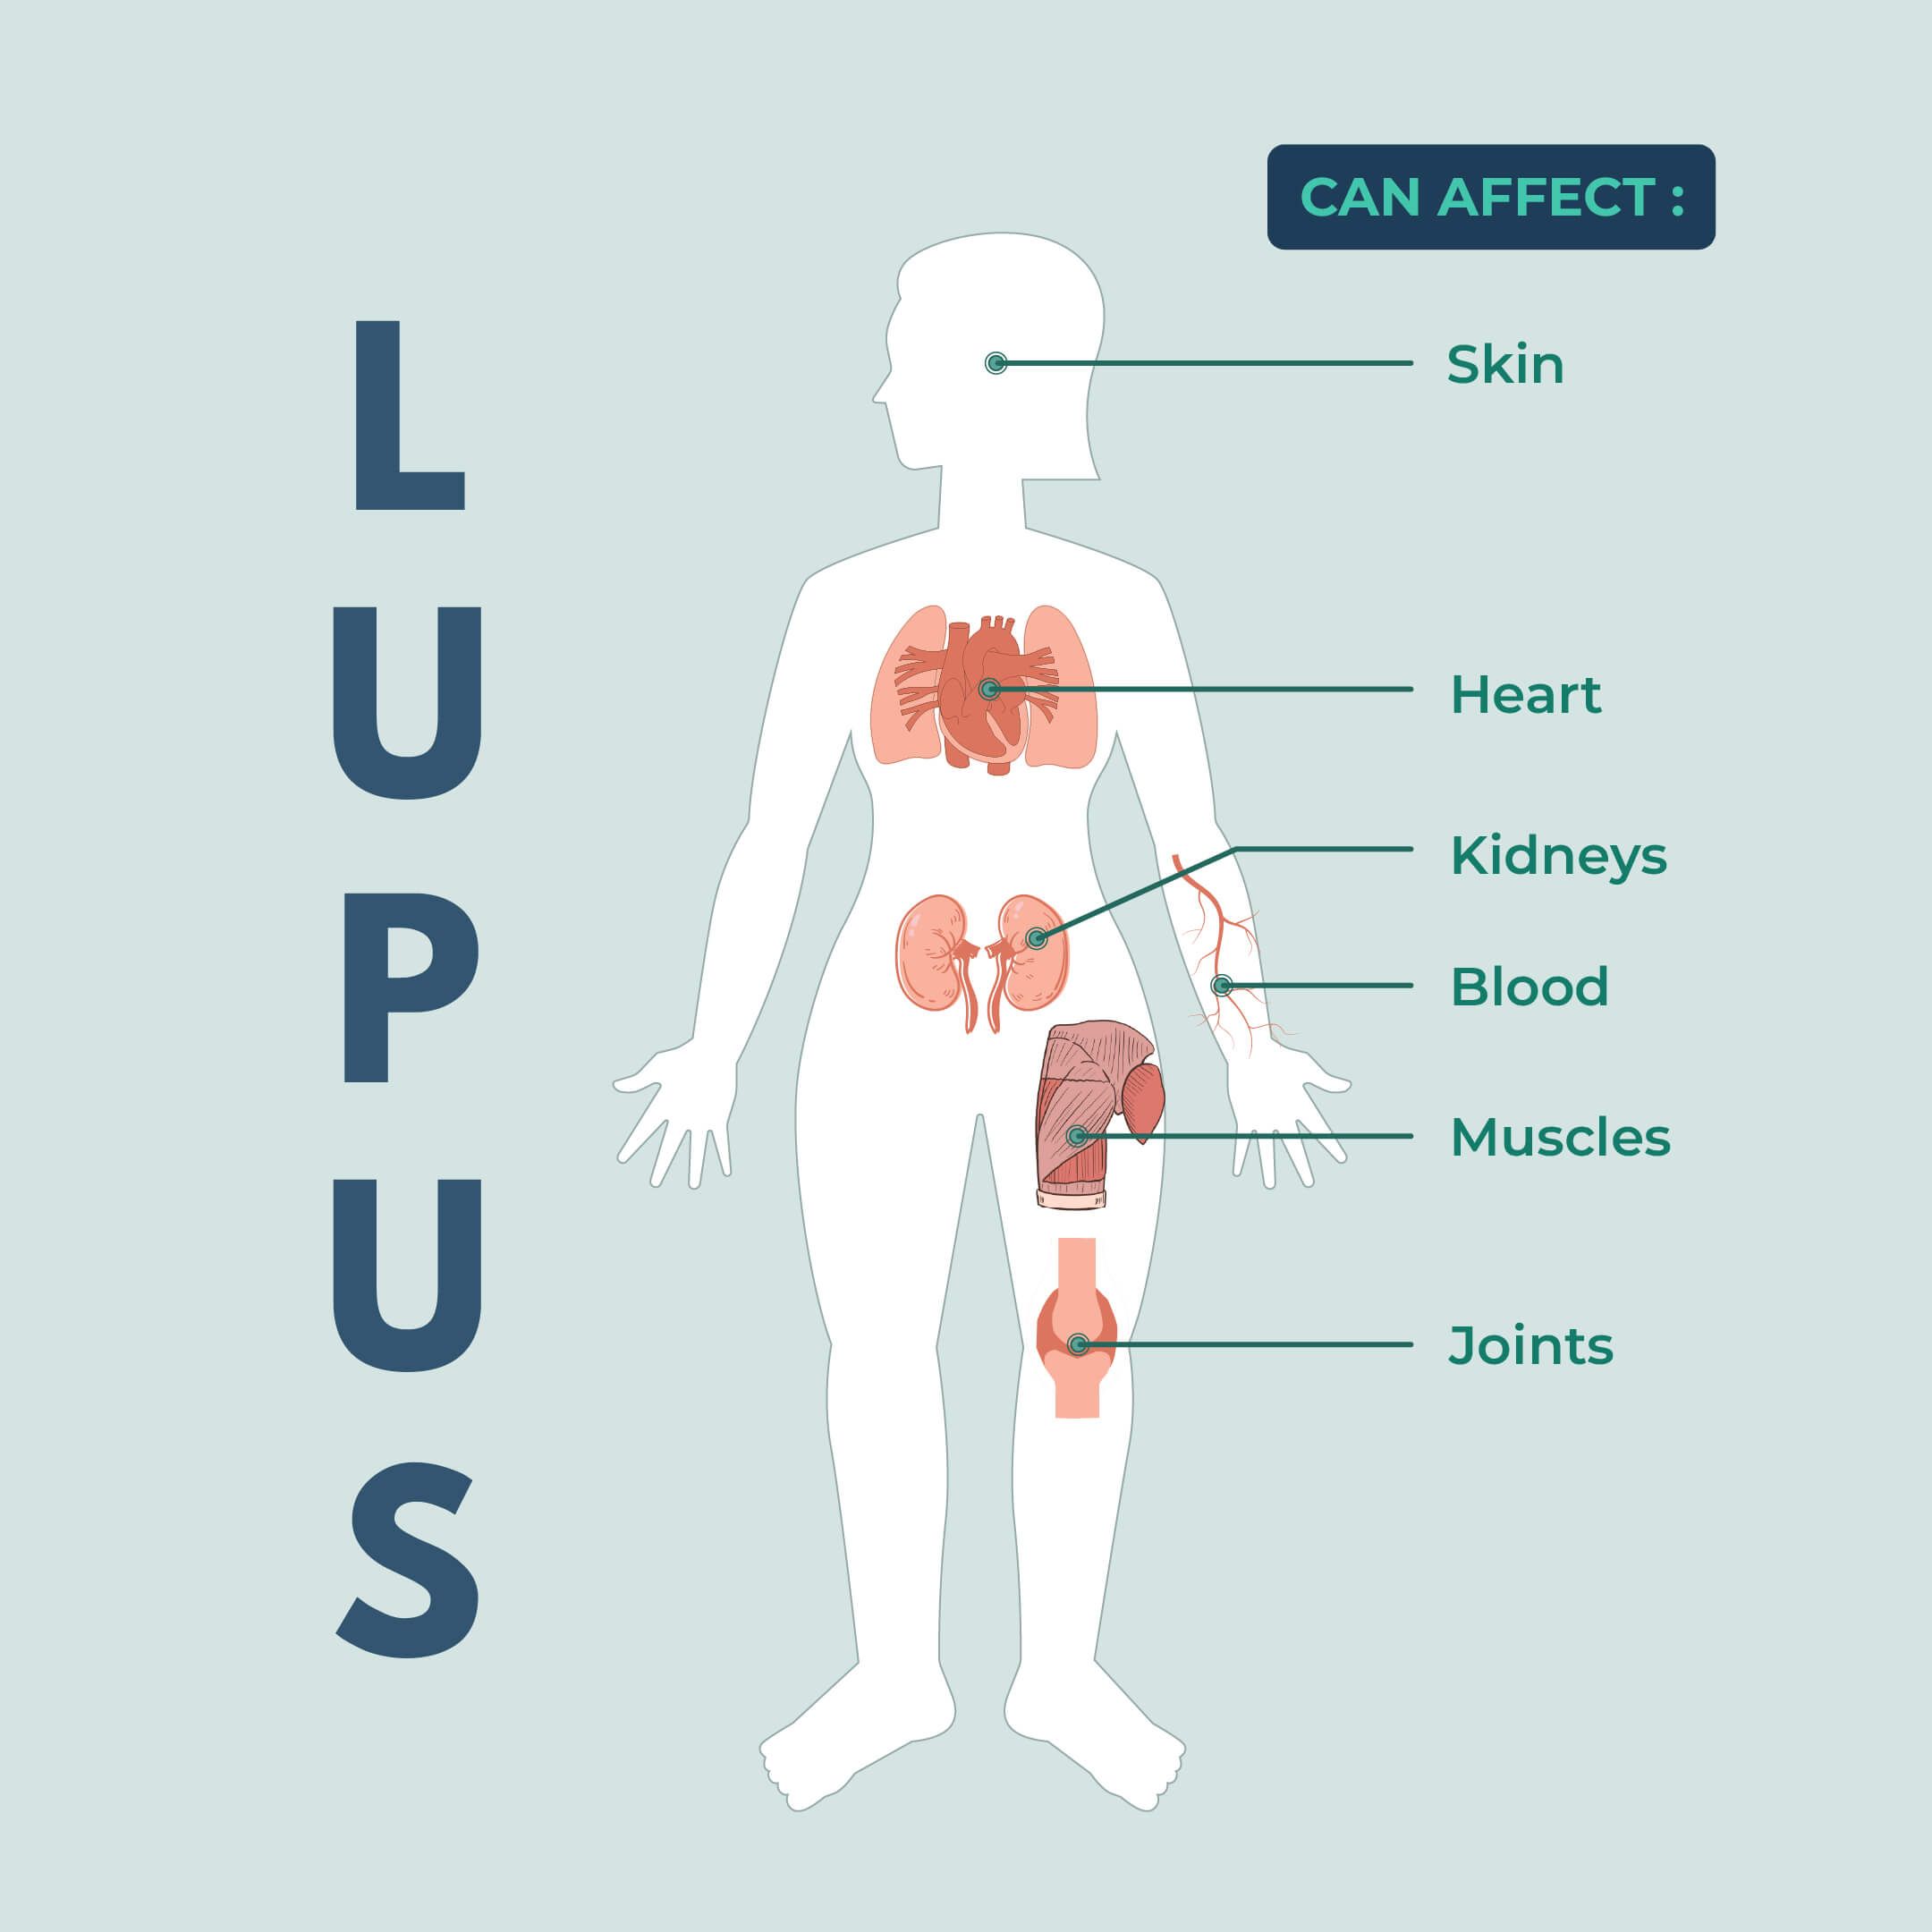
Lupus is an autoimmune disease that causes chronic inflammation in the body, primarily in connective tissues like cartilage and the lining of blood vessels.
In autoimmune diseases, the immune system mistakes the healthy cells in your body as dangerous invaders and attacks them.
Lupus may affect other body systems, including the skin, joints, kidneys, brain, heart, and lungs.
Though the exact cause of this disease is unknown, this autoimmune disease is believed to occur due to genetics and the environment.
It has been observed that some people with a genetic tendency for lupus develop the condition on exposure to something in the environment that triggers the disease.
Lupus is more common in women between ages 15 and 45.
It is difficult to diagnose lupus as its signs and symptoms are similar to other conditions.
No, lupus is not an inherited condition.
However, certain gene variants are associated with lupus risk.
People may inherit these gene variants, which may increase or decrease their risk for the condition.
It has been found that 20% of people with lupus have a parent or sibling with this condition.
Around 5% of children with a parent having lupus may develop the condition.
Though studies around the genetics of lupus are still underway, scientists have identified at least 60 genes that may increase an individual’s risk for systemic lupus erythematosus.
Studies have shown that a class of genes called the major histocompatibility complex (MHC) is associated with lupus.
These genes perform various functions in the body, including:
Lupus is polygenic - multiple gene variations contribute to the disease.
However, some single gene variations are also responsible for lupus.
The most common single gene mutation that causes lupus is complement deficiency.
Another monogenic cause of lupus is a mutation or abnormal change in the PRKCD gene.
This mutation results in the formation of excessive T cells and stimulates B-cells to convey improper signals to the immune system, triggering lupus symptoms.
Lupus is often seen running in families as the gene changes that increase the risk of this condition can be inherited across generations.
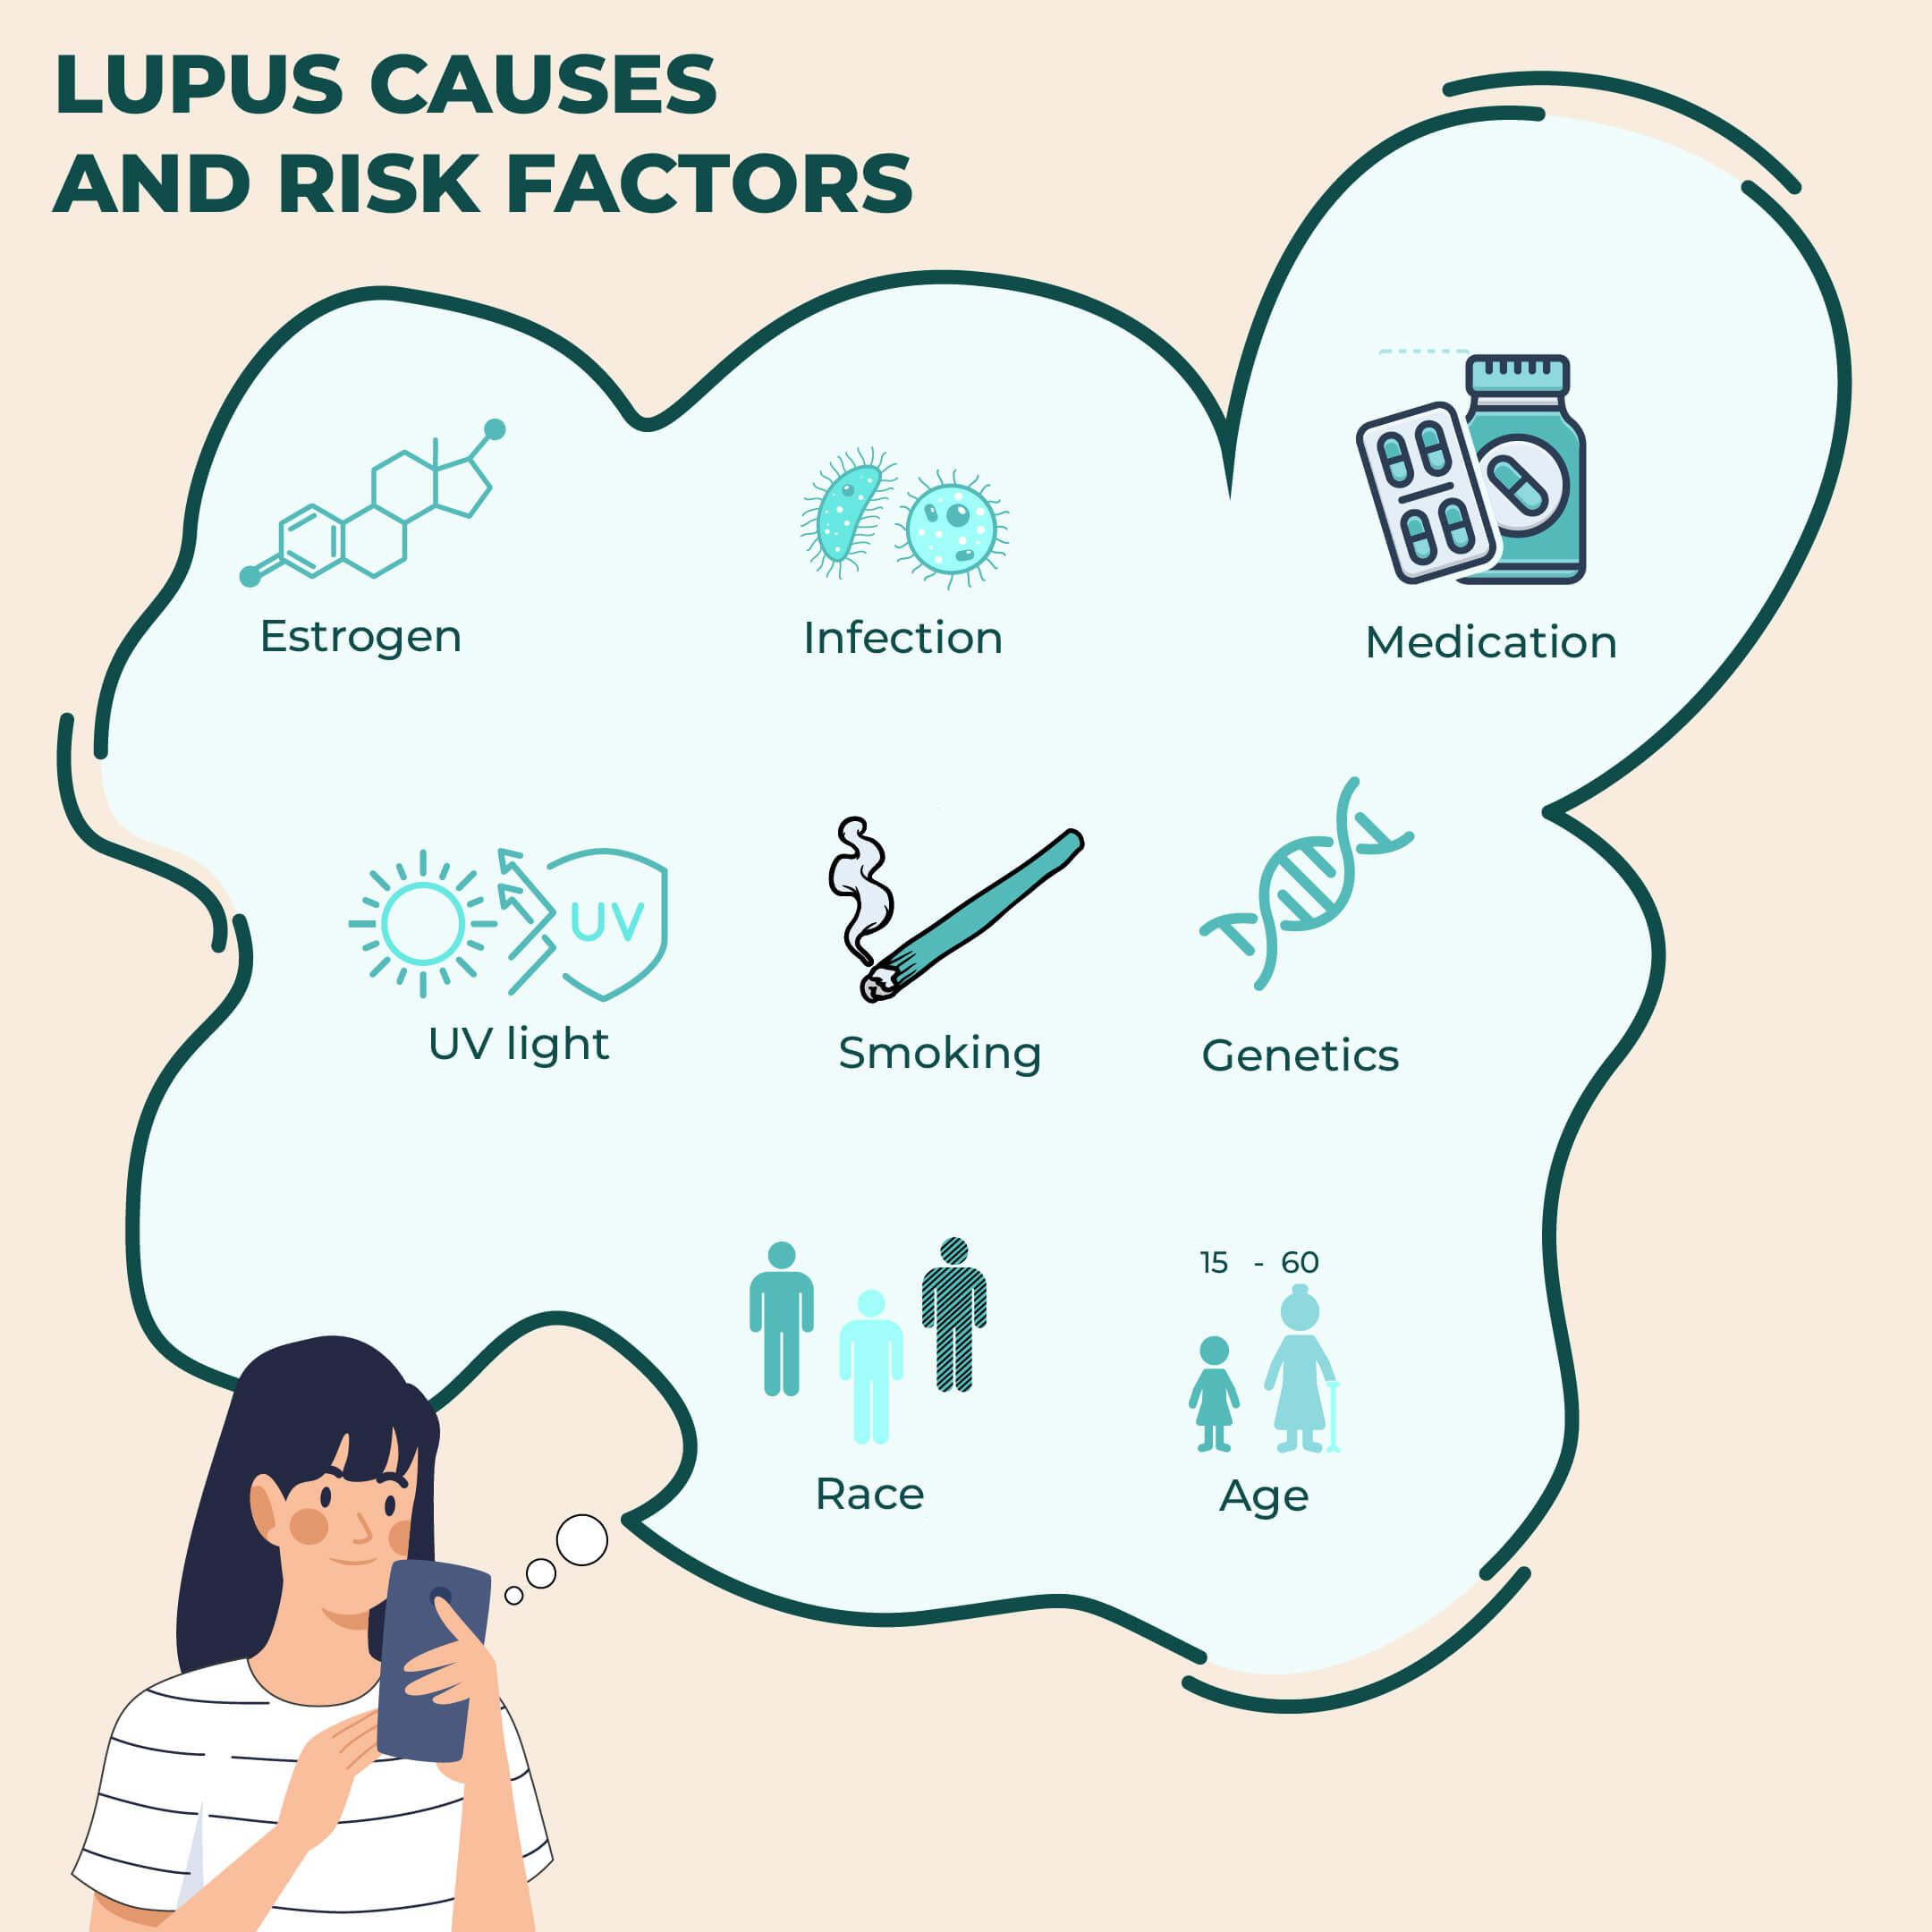
A few potential triggers of lupus include:
Signs and symptoms of lupus vary in every individual. They may develop slowly or come suddenly, may be mild or severe.
People with mild lupus usually have shorter episodes of symptoms, and these are called flares.
The most common symptoms of lupus are:
Apart from these general symptoms of lupus, women of African-American or Hispanic origin may also experience kidney complications, osteoporosis, and heart disease.
While systemic lupus erythematosus (SLE) is the most common form of lupus, other types of this condition are:
This type of lupus affects the skin. Besides skin lesions and sensitivity to the sun, people with this type of lupus may also experience hair loss.
This type of lupus is caused by some medications and may resolve once the medication is stopped.
People with drug-induced lupus may have other symptoms similar to systemic lupus erythematosus.
This rare type of lupus is found in infants at birth.
Children born with this type of lupus receive antibodies from their mothers who had lupus at the time of birth or may develop the condition later in life.
Factors that may increase an individual’s risk for lupus include:
Stereotypes are total cliches. They are generalized representations of a particular culture and its people and are usually inaccurate. However, sometimes, these stereotypes are based on facts and have some resemblance to reality. Here, we discuss some unique physical traits common to the German people. Their rich cultural traditions and heritage all give the Germans a distinct identity.
Germany is a Central European country and is the second most populated nation on the continent.
Germany has some of the most vibrant and diverse cultures and a rich heritage of arts, literature, philosophy, and food.
Germans established themselves as an ethnic group after separating from the Middle Ages Frankish Empire and forming the Kingdom of Germany.
This empire expanded eastwards and established a new nation.
The Germans were pastoralists whose milk, cheeses, and meat came from their flocks and herds.
They crafted wood, clay, or leather utensils and farmed root crops, vegetables, and grains.
Germans have some unique physical traits that distinguish them from the rest of the world.
They have blue eyes, light skin, and a square face.
Here are a few physical characteristics common to most Germans.

Germany is one of the countries with the tallest people in the world.
While males have an average height of 5 feet 11 inches, females are around 5 feet 4 inches.
A small percentage of Germans have curly hair.
This is due to a combination of genetic and environmental factors.
Physical traits can offer a clue to a person's ancestry.
However, to be sure, you must check a person's family history, birth records, and online resources and archives.
Got an ancestry test done? Get access to 10+ health and wellness reports (starting at $30) using your raw DNA data.
Now that you know a few things about German personality and cultural traits, let's discuss some of the prominent people with German ancestry:

While many of these stereotypes associated with Germans, such as blonde hair and blue eyes, may be accurate, we should ultimately judge a person not based on their physical appearance.
Understanding these stereotypes can be an exciting part of understanding your ancestry and heritage.
It's essential to approach discussions with people based on individual differences and not on these stereotypes.

Jewish DNA Test: Can Genetic Tests Help Identify Jewish Ancestry?
Haplogroups: The Key To Unraveling Ancestral Origins

7 Physical Signs Of Viking Ancestry That May Suggest You Have Viking DNA
https://www.reddit.com/r/germany/comments/12okc5q/what_does_it_mean_if_someone_looks_german/
With AncestryDNA's Ancestry Storymaker Studio, your ancestry test doesn't stop with just learning about your ethnicity and heritage! This tool not only helps preserve your family history but also turns it into a story. Whether it's your grandparents' immigration journey, great-great-grandfather's military service, or family's favorite holiday tradition, there are means to record, edit, publish, and cherish it all! Read on to learn more about this tool, its features, and whether it's available for free or requires a charge.
Ancestry Storymaker Studio is a new tool built into the app by AncestryDNA that effortlessly allows users to create and share stories within their family tree.
It has a suite of advancements that bring you some exciting features. The top 3 are explained below.
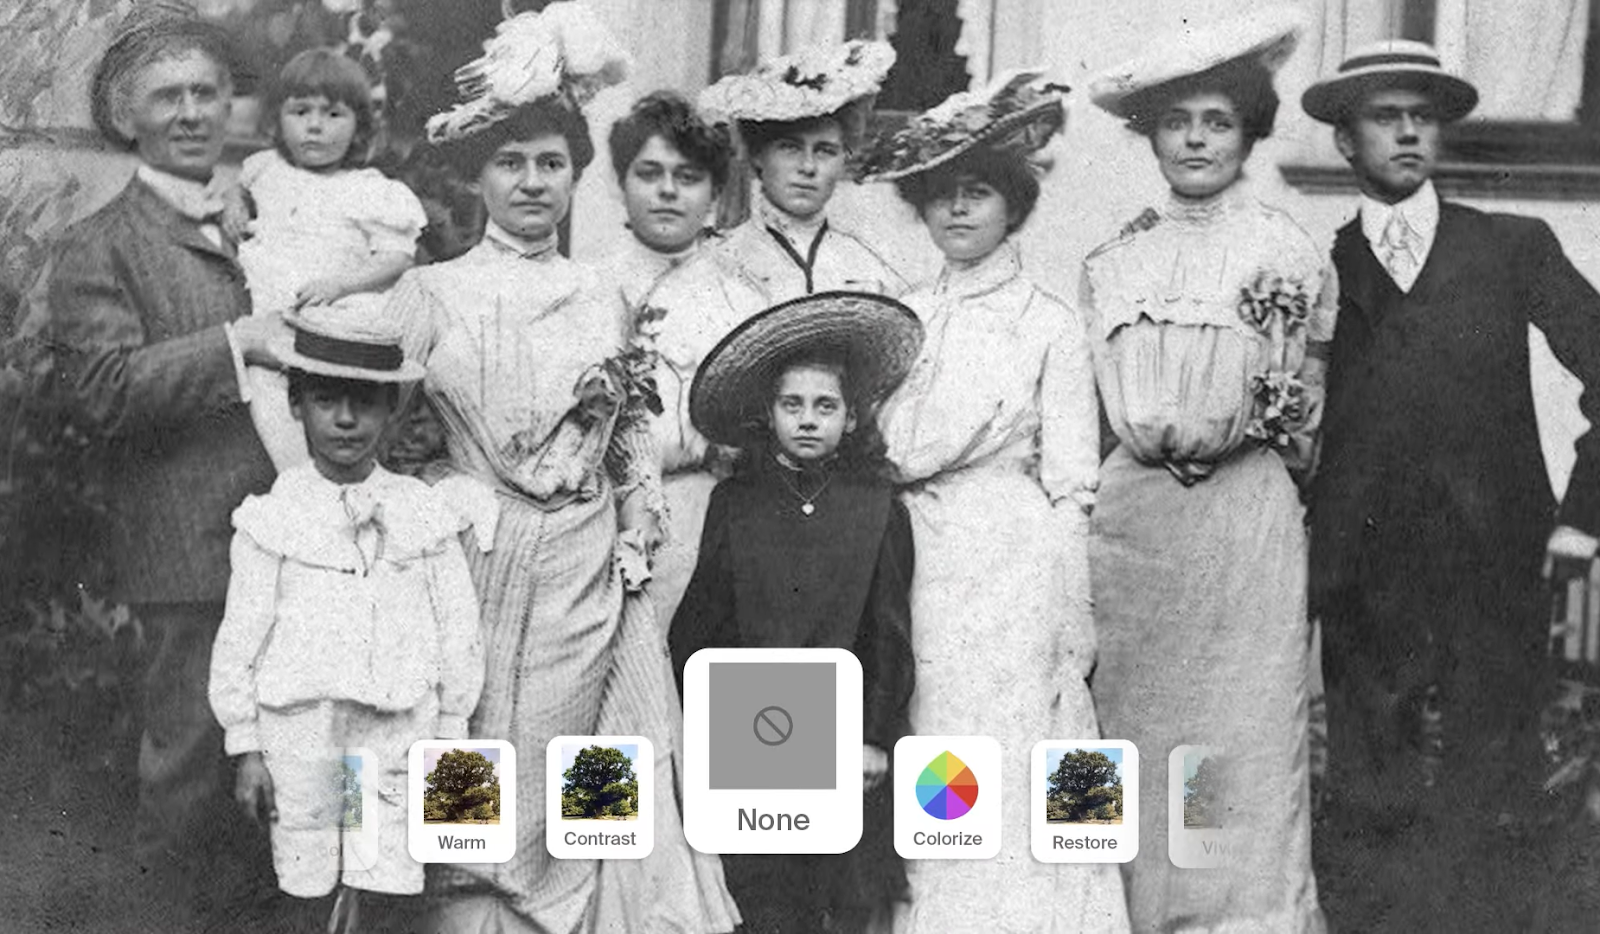
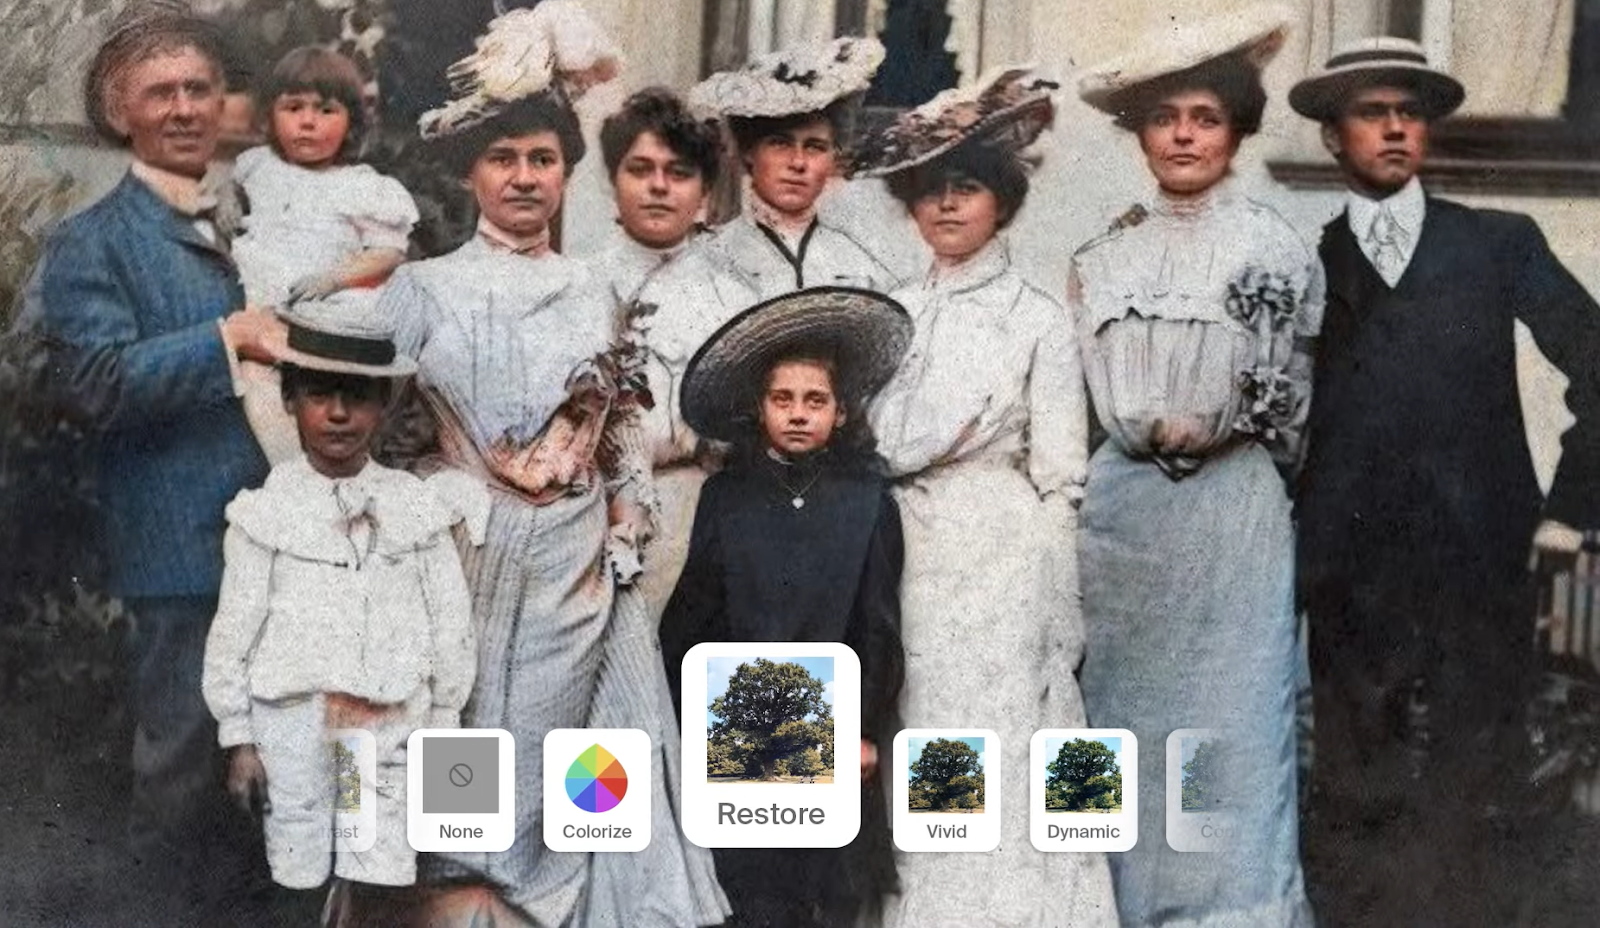
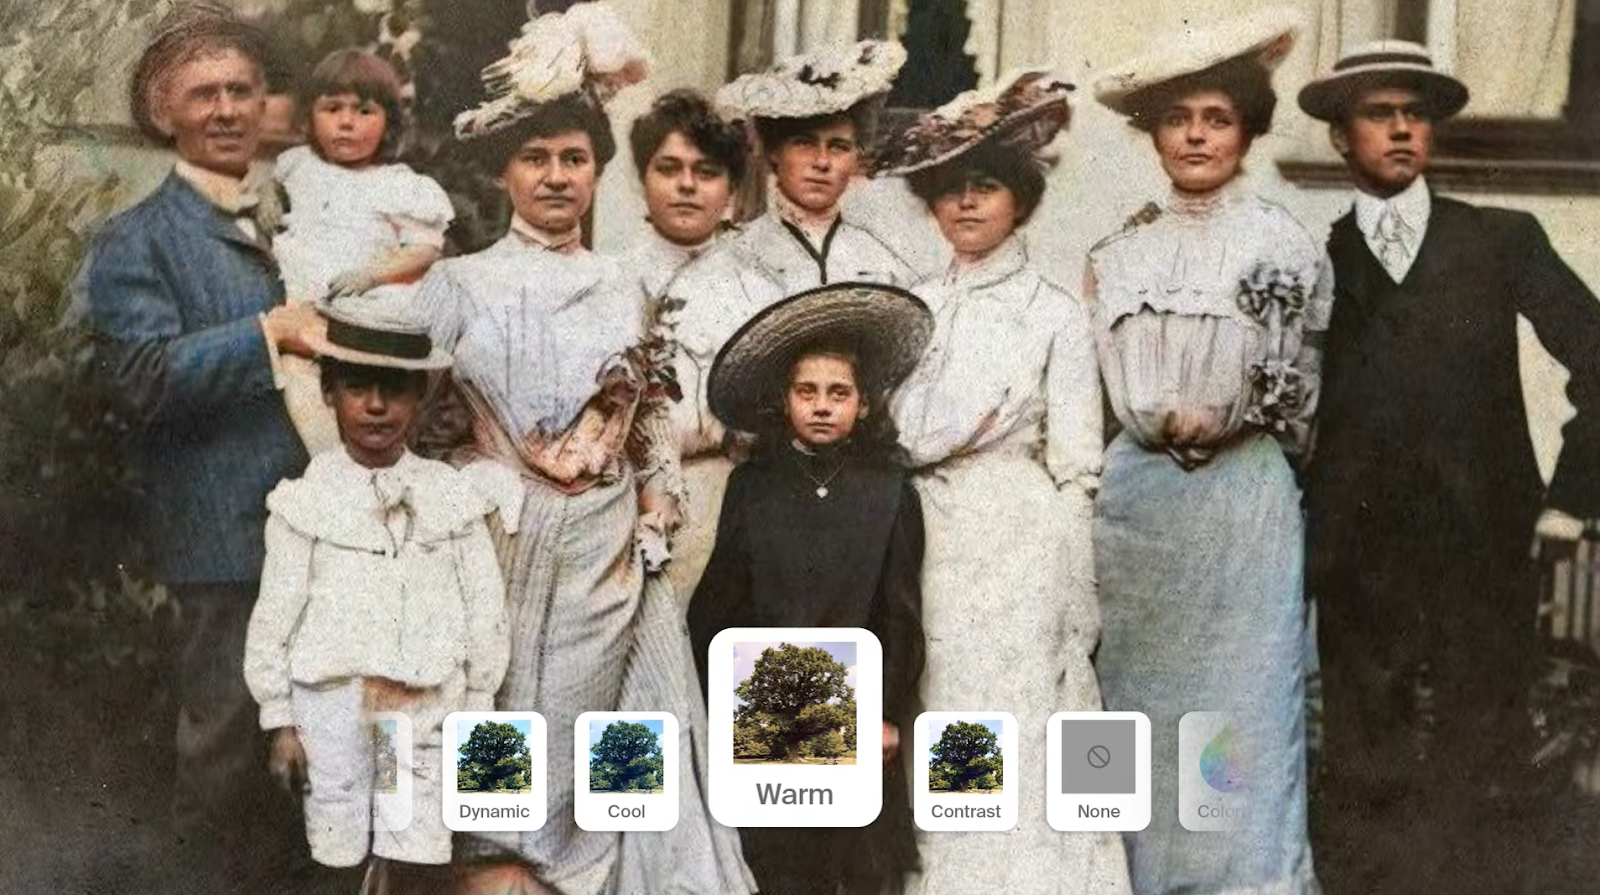
One of the core features of Ancestry Storymaker Studio is the ability to enhance photos easily.
Users can sharpen, crop, and add color to their family photos, breathing new life into old memories.
Here are a few examples:
| Before colorization | After colorization |
 |  |
 |  |
| One photo - multiple filters | |
 |  |
 |  |
Another powerful feature of Ancestry Storymaker Studio is the capability to capture audio and add it to your family ancestry stories.
Users can record up to 14 minutes of audio narration in their own words, providing a rich and authentic account of family events and cherished memories.
This audio feature allows users to preserve the voices and stories of their loved ones, passing down a legacy for future generations.
Note: iOS users can look forward to this feature soon, as the development is underway.
Crafting and sharing family ancestry stories has never been easier than with Ancestry Storymaker Studio.
Whether it's a tale of a revolutionary ancestor, a heartwarming family event, or cherished family recipes passed down through generations, the possibilities are endless.
Users can create a customized slideshow by adding images, audio recordings, and written memories that authentically capture the essence of the story they wish to tell.
After finishing the story, they can download it onto their phones or share it on their social media and the Ancestry platform.
Did You Know? Your AncestryDNA test DNA data includes 700,000 markers, which can be used to learn everything from disease risk and drug sensitivities to nutritional requirements and fitness parameters. Here's how others like you have benefited by uploading their data to Xcode Life:
To create a story in Ancestry Storymaker Studio, you need to use the Ancestry app on your mobile device and follow these steps:


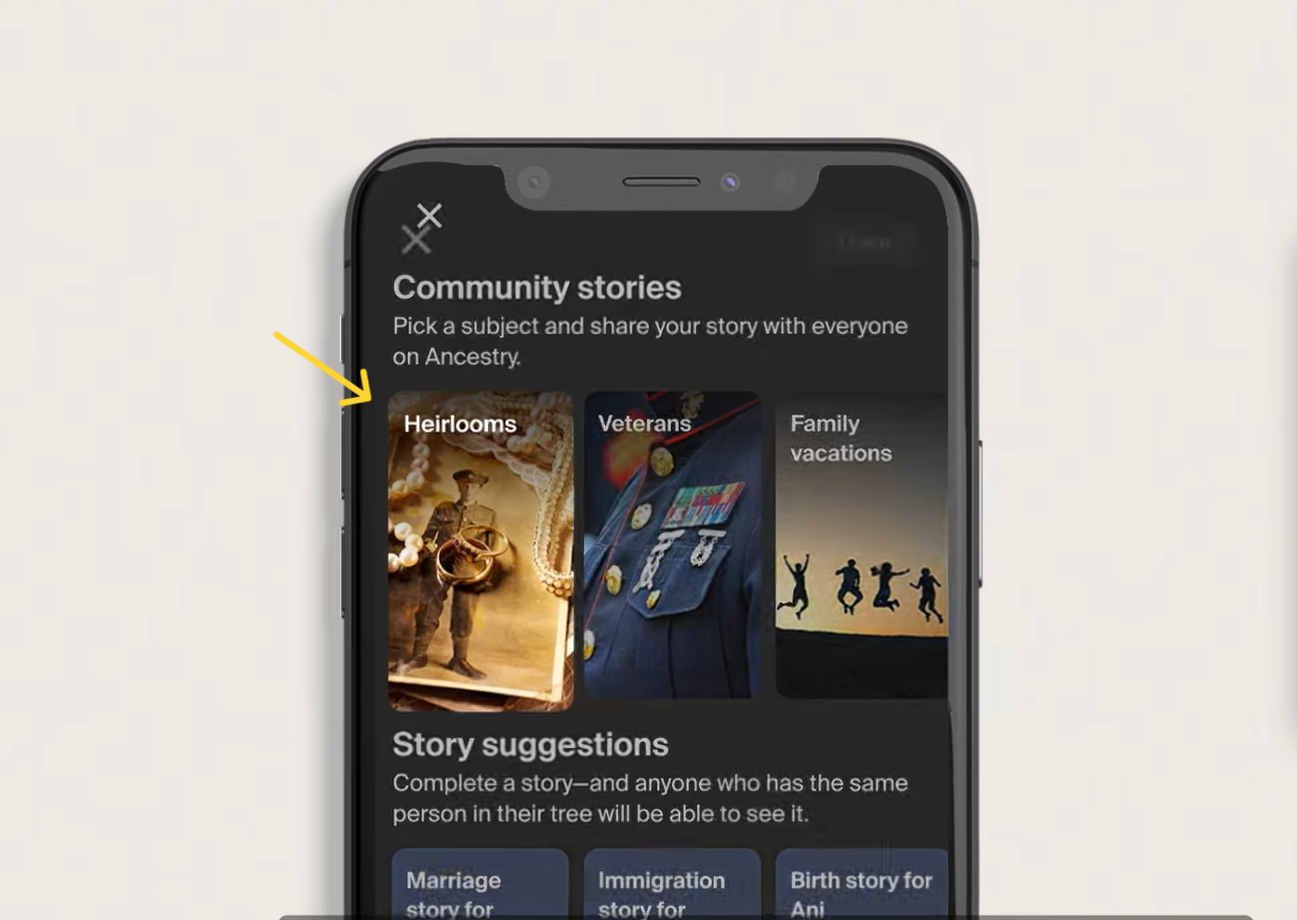


We can access Ancestry Storymaker Studio through two methods, each offering unique features.
From the app
To start with Storymaker Studio on mobile, first download the Ancestry app from the App Store (for iOS users) or Play Store (for Android users).
Once you have installed the app, you can follow these simple steps to access Storymaker Studio:
From a browser
For those who prefer accessing Storymaker Studio from a browser, the process is just as straightforward:
While certain functionalities are exclusively available on the app, they will soon be accessible on the Ancestry website.
The platform offers multiple ways to share your creation with your loved ones, including:
Yes, you certainly can! The sharing capabilities of Ancestry Storymaker Studio extend beyond the platform itself.
It offers a variety of customizable slide options that can perfectly fit the dimensions of popular social media platforms.
Whether you prefer sharing on Facebook, Instagram, or Twitter, Storymaker Studio lets you take your stories to the broader virtual world.
Got an ancestry test done? Get access to 10+ health and wellness reports (starting at $30) using your raw DNA data.
Currently, Ancestry Storymaker Studio is available for free through the Ancestry mobile app.
Users can access and utilize this powerful storytelling tool without any additional cost.
Ancestry Storymaker Studio has taken the genealogy world by storm, earning praise from journalists and users alike.
Let's look at what some prominent voices say about this innovative storytelling tool.
According to journalist @rolds22 from Deseret News on Twitter.
Storymaker Studio is a magical one-stop shop for creating, preserving, and sharing your family history stories.
You can upload voice recordings, edit and enhance photos, and even get some cool story prompts to help you along.
Another Twitter user praised Ancestry Storymaker Studio's user-friendly interface and interactive features that make storytelling engaging and captivating.
“The tool successfully tackles the common problem of "glazed-over eyes" during genealogy discussions, making it accessible and enjoyable for everyone.”
Do Ancestry DNA Kits Expire?
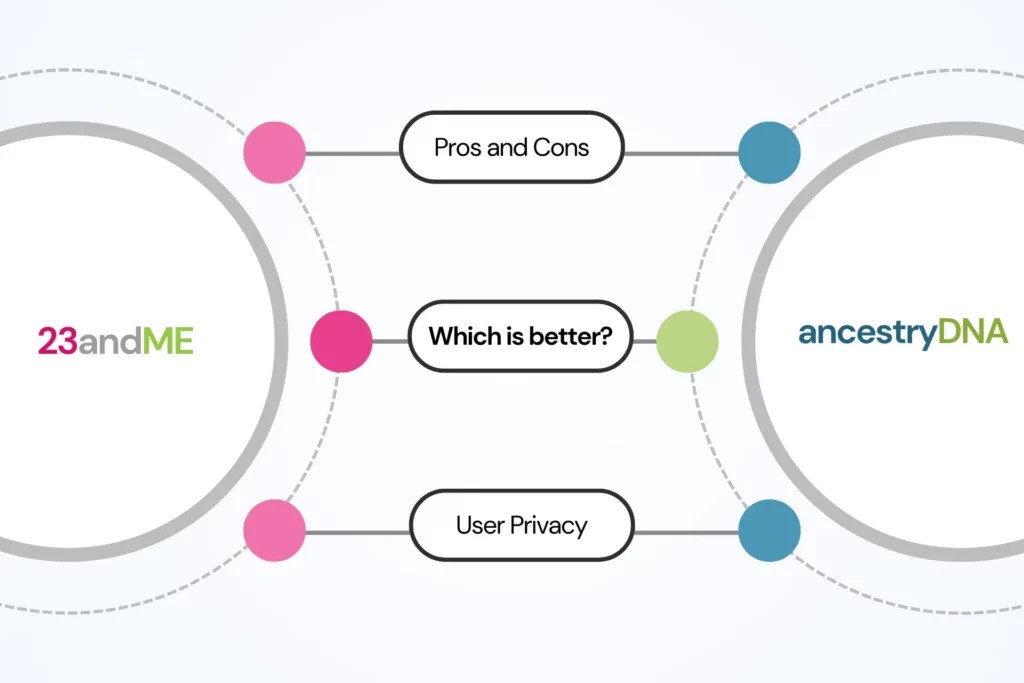
AncestryDNA vs 23andMe: Which Is Better For Raw Data Analysis?

Is There A Connection Between Your Foot Shape And Ancestry?
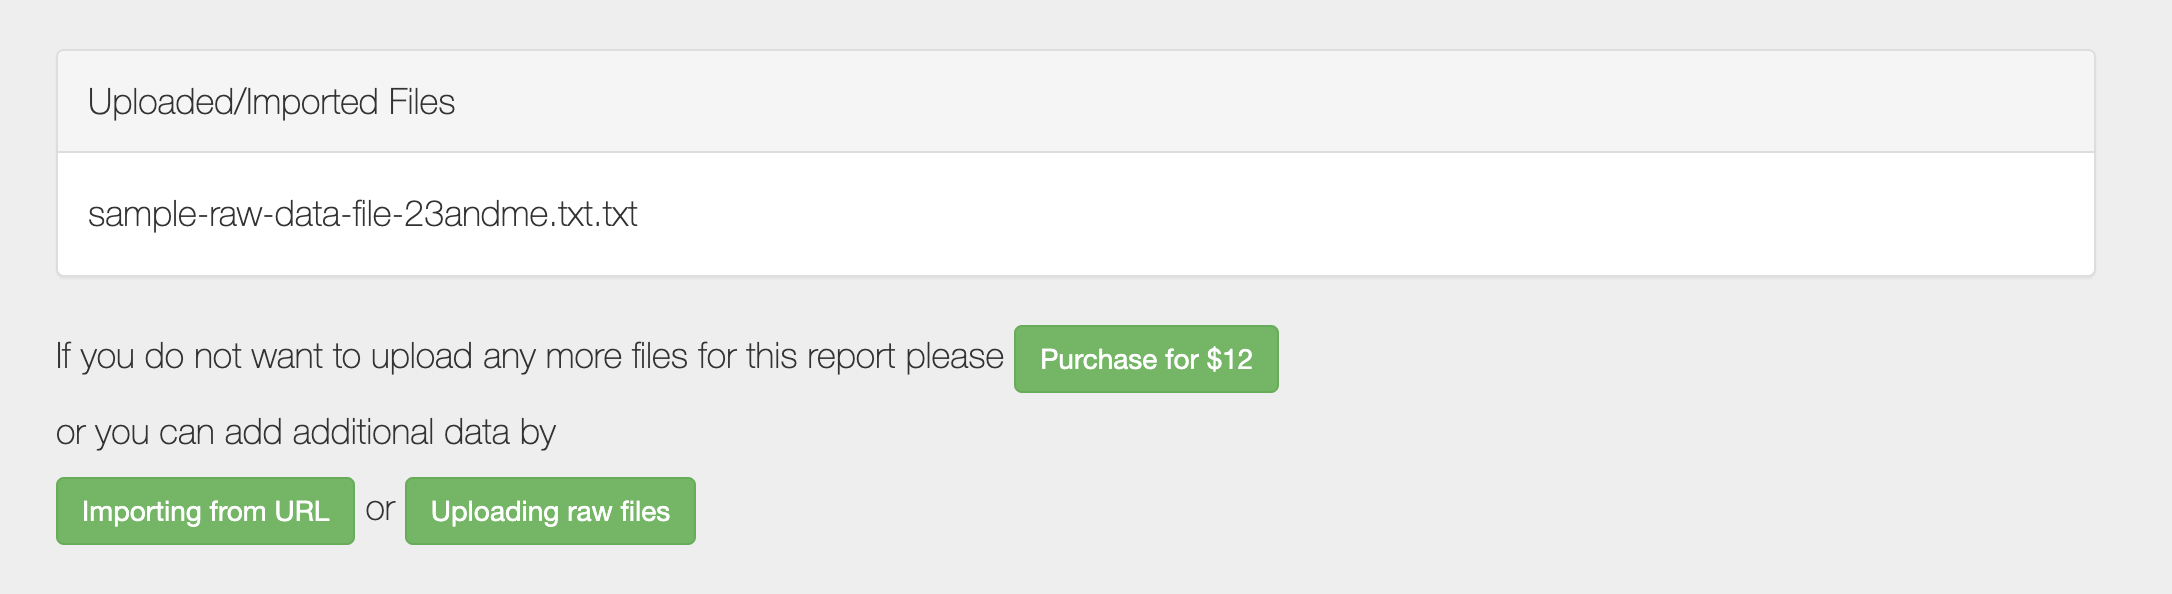
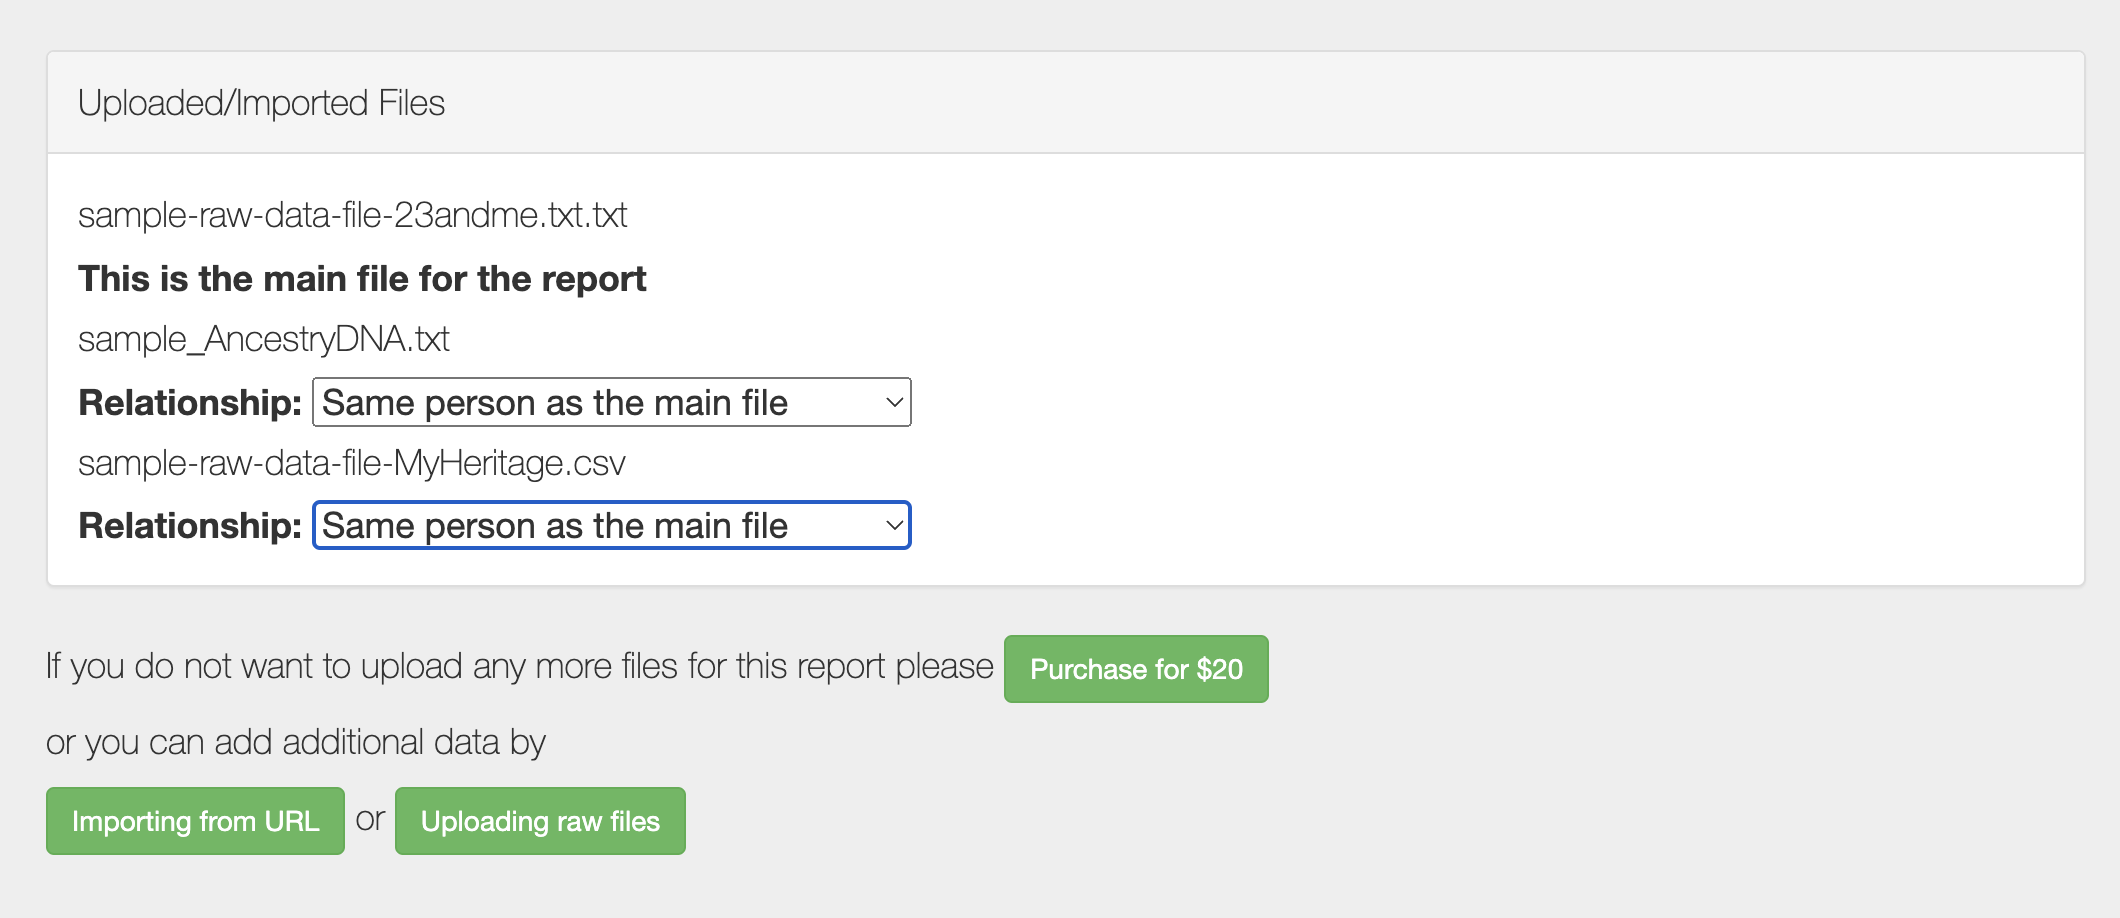
Promethease is an online tool that analyzes raw DNA files inputted by users to generate personalized DNA reports based on genetic literature.
The information in the report is based on SNPedia, a wiki-based online database that summarizes health and ancestral implications of genetic variants.
Though popular, it is often criticized to be too technical and difficult to read. You can take a look at Promethease's sample report.
MyHeritage offered Promethease free of charge through the end of 2019 and continues to maintain SNPedia as a free resource for academic and non-profit users. For non-European users, the raw DNA data will be shifted to MyHeritage and added to new accounts, which will be created for them. However, the users will retain the ownership of their DNA raw data file and are free to delete it from MyHeritage’s server.
A Promethease report provides a comprehensive analysis of your genetic data, covering various aspects such as:
Before you get into reading your Promethease report, it will help to know the meaning of a few terms that are frequently used in them. They are tabulated below.
| Term | Description |
|---|---|
| Repute | This is a parameter that is applied to a genotype. It can be good, bad or not set. This is based on a general opinion. |
| Magnitude | It tells you how interesting your genotype is. It is purely a subjective parameter. It is a numerical value between 0 and 10, with 0 assigned to boring information and 10 being assigned to really significant information. This can be set to whichever value you prefer. Most users set this value up to a moderate 5. |
| Orientation | As we know, genetic studies are based on genes. Orientation is simply the chromosome position of these genes. These positions are based on a reference human genome. The present build is GRCh38 patch 12, that was released in December 2017 (you don’t have to remember this!). |
| Frequency | How rare or common a genotype is in your population. |
| Geno Time | Timestamp when the genotype page was last updated. This is with reference to SNPedia. |
| ClinVar | If you select that button, only health conditions that are found in ClinVar will be displayed. ClinVar is a public archive of reports of the relationships among human gene variations and phenotypes, with supporting evidence. |
| Genosets (gs IDs) | A genoset is a defined set of genotypes that are associated with a particular phenotype. |
| SNPs for the other sex | Many people are taken aback by this term. Don’t worry about this. It simply tells you that manifestations of these SNPs are irrelevant to your sex. For example it is irrelevant to a woman, how an SNP can increase the risk for prostate cancer. |
| GMAF | Stands for Global Minor Allele Frequency. The allele (an alternative form of your gene) that is less common in the global gene pool. This is as per the 1000 Genomes Project. |
| Carrier | Many of you may already be familiar with this term. Carriers are individuals who carry only one copy the risky allele. It is of significance only in disorders that are know to be caused due to a single gene mutation like Cystic Fibrosis or Huntington’s disease (a.k.a Mendelian disorders). Carriers do not manifest the disease but may pass on the mutant allele to the next generation. |
| CI | Stands for Confidence Interval. The range within which a value can be deemed true with a certain degree of confidence. It is usually taken as 95%. |
| de novo mutation | True to the name, it means a new mutation that was not found in both your parents. |
| CNV | Stands for Copy Number Variants. Number of copies of the gene you have in your genome. Large copy number of genes are commonly found in many forms of cancer. |
| Haplotype | A specific combination of SNPs all occurring on the same chromosome. This is all chromosomes inherited from your mother or father. |
| Diplotype | It refers to a specific combination of haplotypes. |
| Familial risk | It is a comparison between the risk of individuals with relatives with a disease to the risk of individuals with relatives who do not have the same disease. |
| GWAS | Stands for Genome-Wide Association Study. A study of the markers (usually SNPs) across the entire genome to see which ones are statistically more or less common in one group of people (often patients with a specific disease) compared to another group of people (typically people unaffected by that disease). |
| In/dels | They are a type of polymorphism that involves the insertion or deletion of slightly bigger sequence of bases. |
| SNP | Stands for Single Nucleotide Polymorphism. As the name suggests, it is a change occuring in only one base. |
| Odds ratio (OR) | It is a useful number to evaluate the association between an allele or genotype with a phenotype. The phenotype might be an inherited trait (like widow’s peak) or a disease (like Type 2 Diabetes). This number is arrived at by comparing carriers of a less common allele to people with 2 copies of the most common allele. |
| Penetrance | The degree to which you're likely to actually have a given trait or phenotype when you carry a given variation. Penetrance is considered high if over 80%, and moderate if between 20 - 80%. |
| Position | Location of an SNP on the chromosome. This position is however only relative to positions in the reference genome sequence. You cannot assign absolute positions to SNPs on a chromosome. |
| Prevalence | The proportion of people with a given condition at a given time. Usually a percentage or a ratio. |
| rs# | All SNPs have an rs identifier that is officially assigned by dbSNP, a public database of SNPs maintained by the National Institute of Health (NIH). |
| Wild-type | The genotype or the allele that is most common in the population and serves as a reference to evaluate all other types of alleles. |
A Promthease genetic report typically contains around 25,000 entries which can be very overwhelming, especially for those without a genetic background.
However, as per the sample files they have for analysis, only 24% of these entries are considered "good."
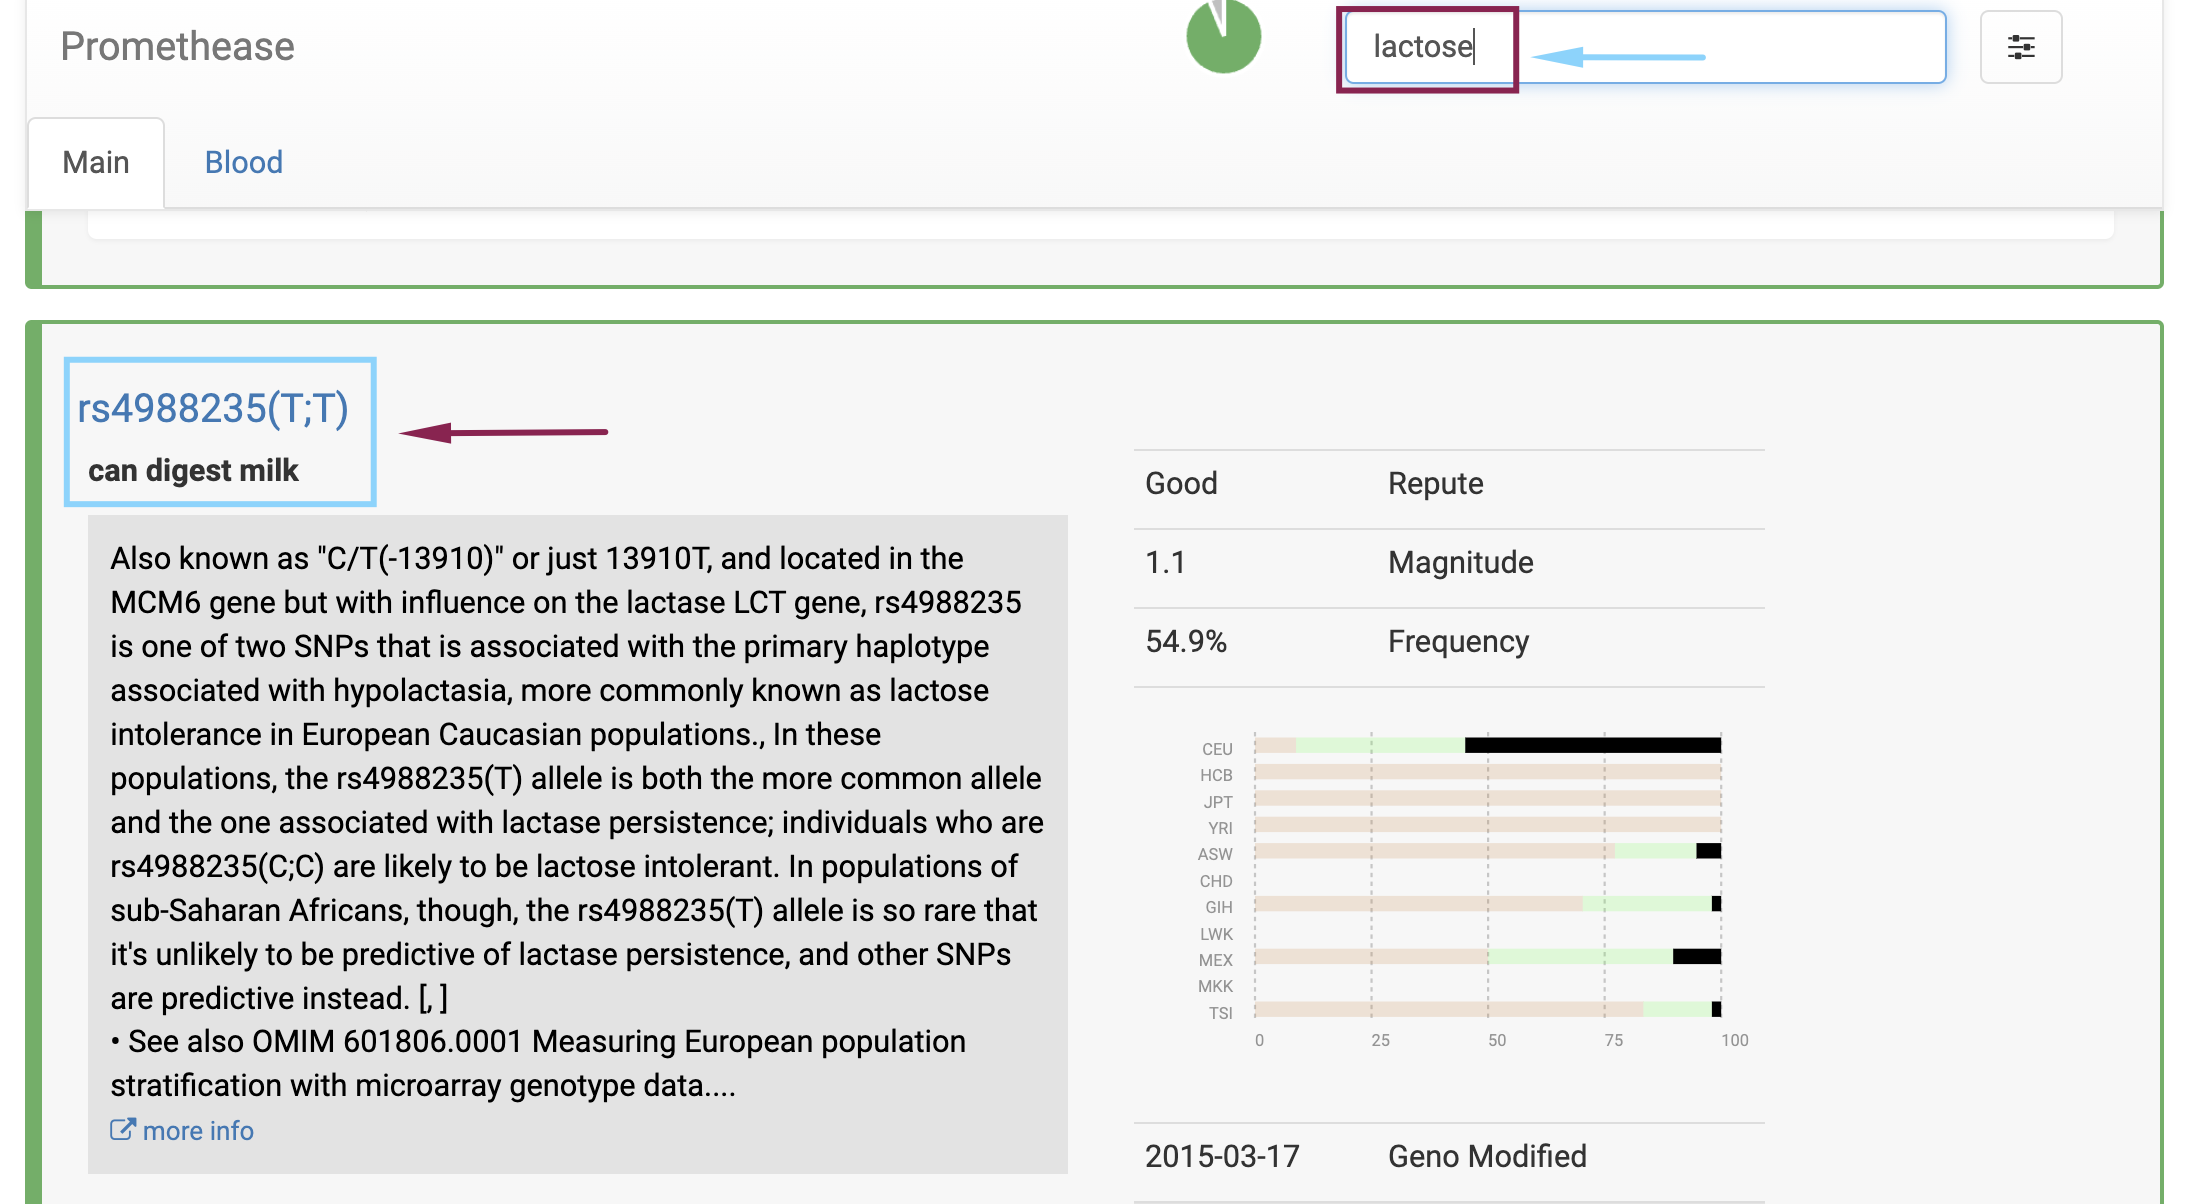
The reports frequently use scientific and technical language, making them difficult to understand for laypersons.
This complexity can lead to confusion and misinterpretation of the results
Promethease reports primarily present data without personalized interpretation or actionable next steps.
There are other genetic analysis services like Xcode Life, which offer tailored advice or recommendations based on the findings.
Users have criticized the interface for being user-unfriendly, which can make navigation and understanding the report more challenging.
Some users have expressed frustration with the overall experience of using the platform.
Further, the reports are primarily text-based and lack visual aids that could help users better comprehend their genetic information.
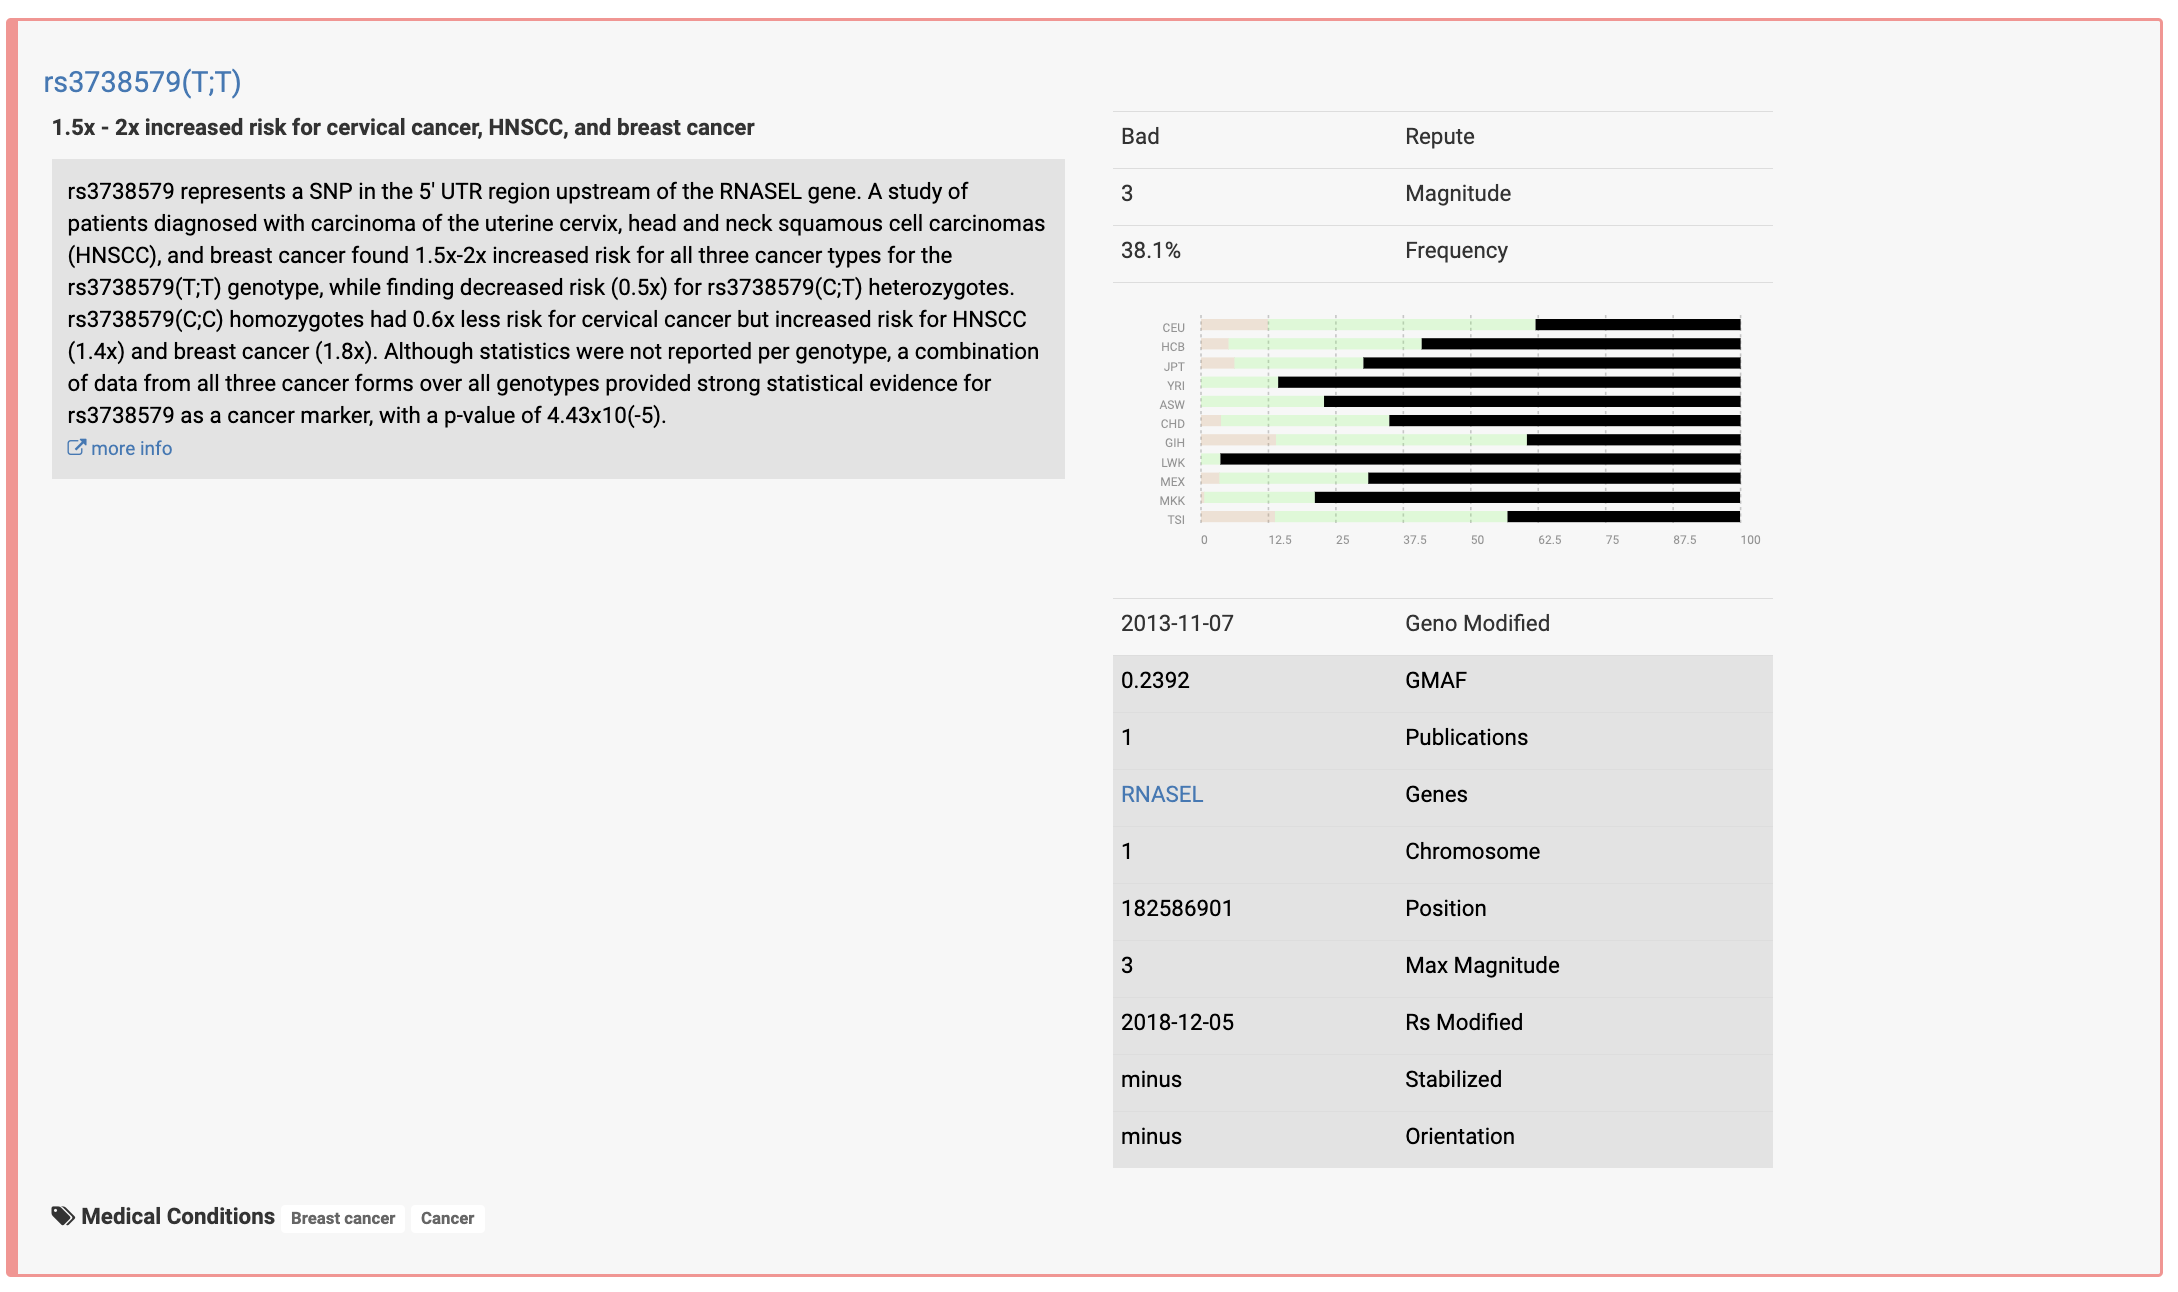
Some reviews suggest that Promethease analysis is known to produce false positives for conditions like breast cancer.
Promethease provides risk estimates based on genetic variants but is not intended for medical diagnosis.
There's no obvious mention of this in their reports.
Thus, there's a risk of users misinterpreting the information, leading to unnecessary anxiety or inappropriate health decisions.
| Xcode Life | Promethease | |
| No. of report categories | 11 | 4 |
| Easy-to-understand reports? | Yes | No |
| Actionable insights | Included | Not included |
| Information sources | Several reputable journals and databases like JAMA, ClinVar, etc. | Only SNPedia |
| Personalized recommendations | Included | Not included |
| Sample reports | Present | Present |
| Report interpretation assistance | Provided | Not provided |
Did you know that gluten sensitivity affects about 6% of the U.S. population, making it more common than celiac disease, which only impacts roughly 1%? Many people experience bloating, fatigue, or digestive discomfort after eating gluten, but not all of them have celiac disease or a wheat allergy. Could gluten sensitivity be in your genes, or are other factors influencing your reaction to gluten? How can you tell if you're at risk? Read on to explore the complexities of gluten sensitivity and uncover what science reveals about the role of genetics and beyond.
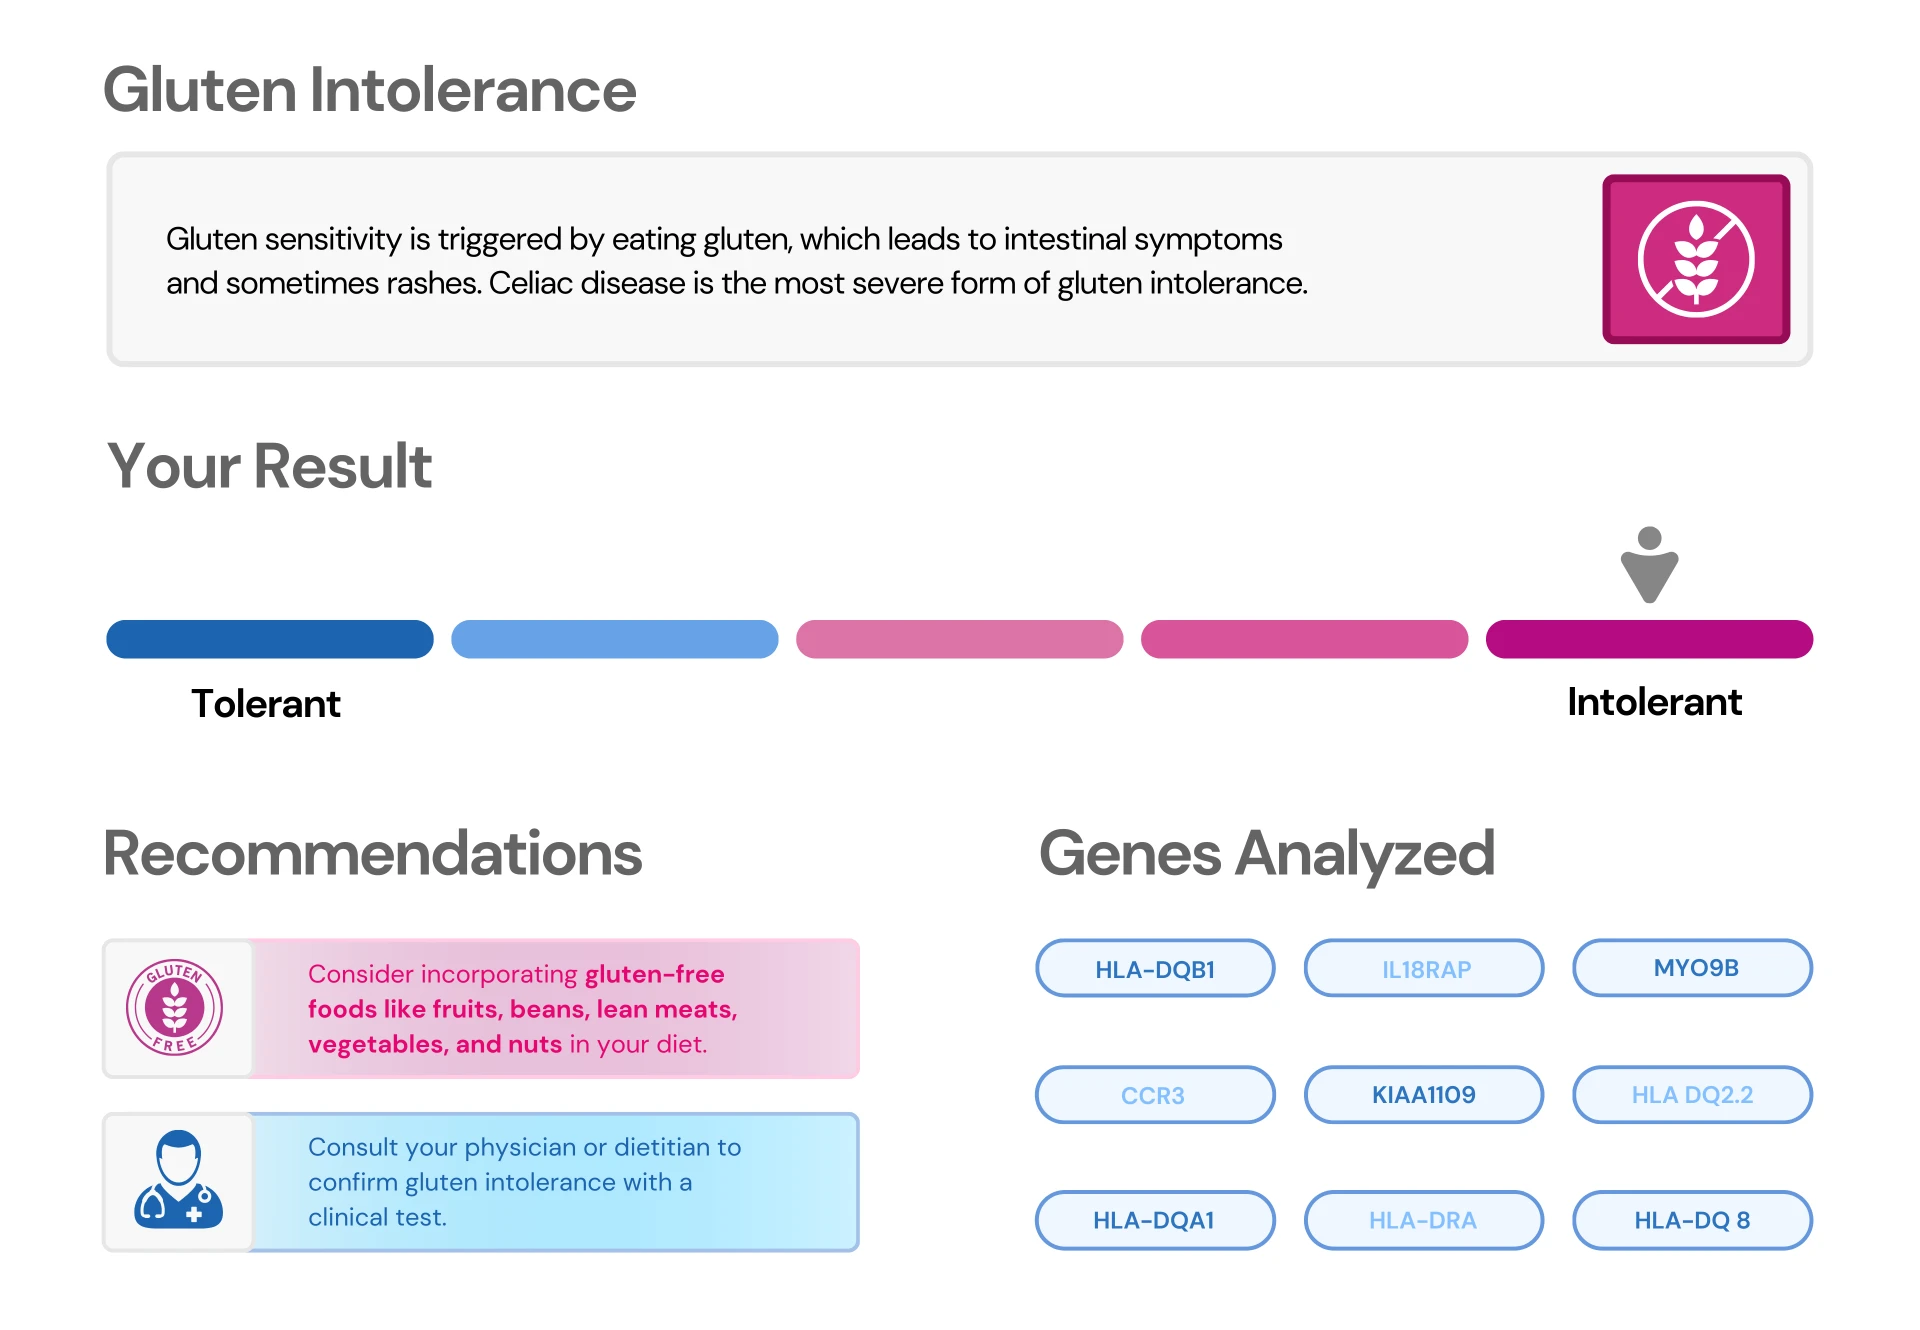
Gluten sensitivity, also termed non-celiac gluten sensitivity (NCGS), is a condition where individuals react negatively to gluten, a protein in barley, wheat, rye, and other grains.
While commonly associated with foods like bread, pasta, and beer, gluten is also found in some non-food items like cosmetics and medications.
It’s important to understand that NCGS differs from celiac disease, which is an autoimmune disorder influenced by gluten consumption.
Unlike celiac disease, NCGS does not cause damage to the intestines and is also distinct from a wheat allergy.
People with gluten sensitivity often experience bloating, gas, fatigue, and nausea.
Genetics plays a pivotal role in gluten sensitivity, with the condition often running in families and appearing in siblings or cousins.
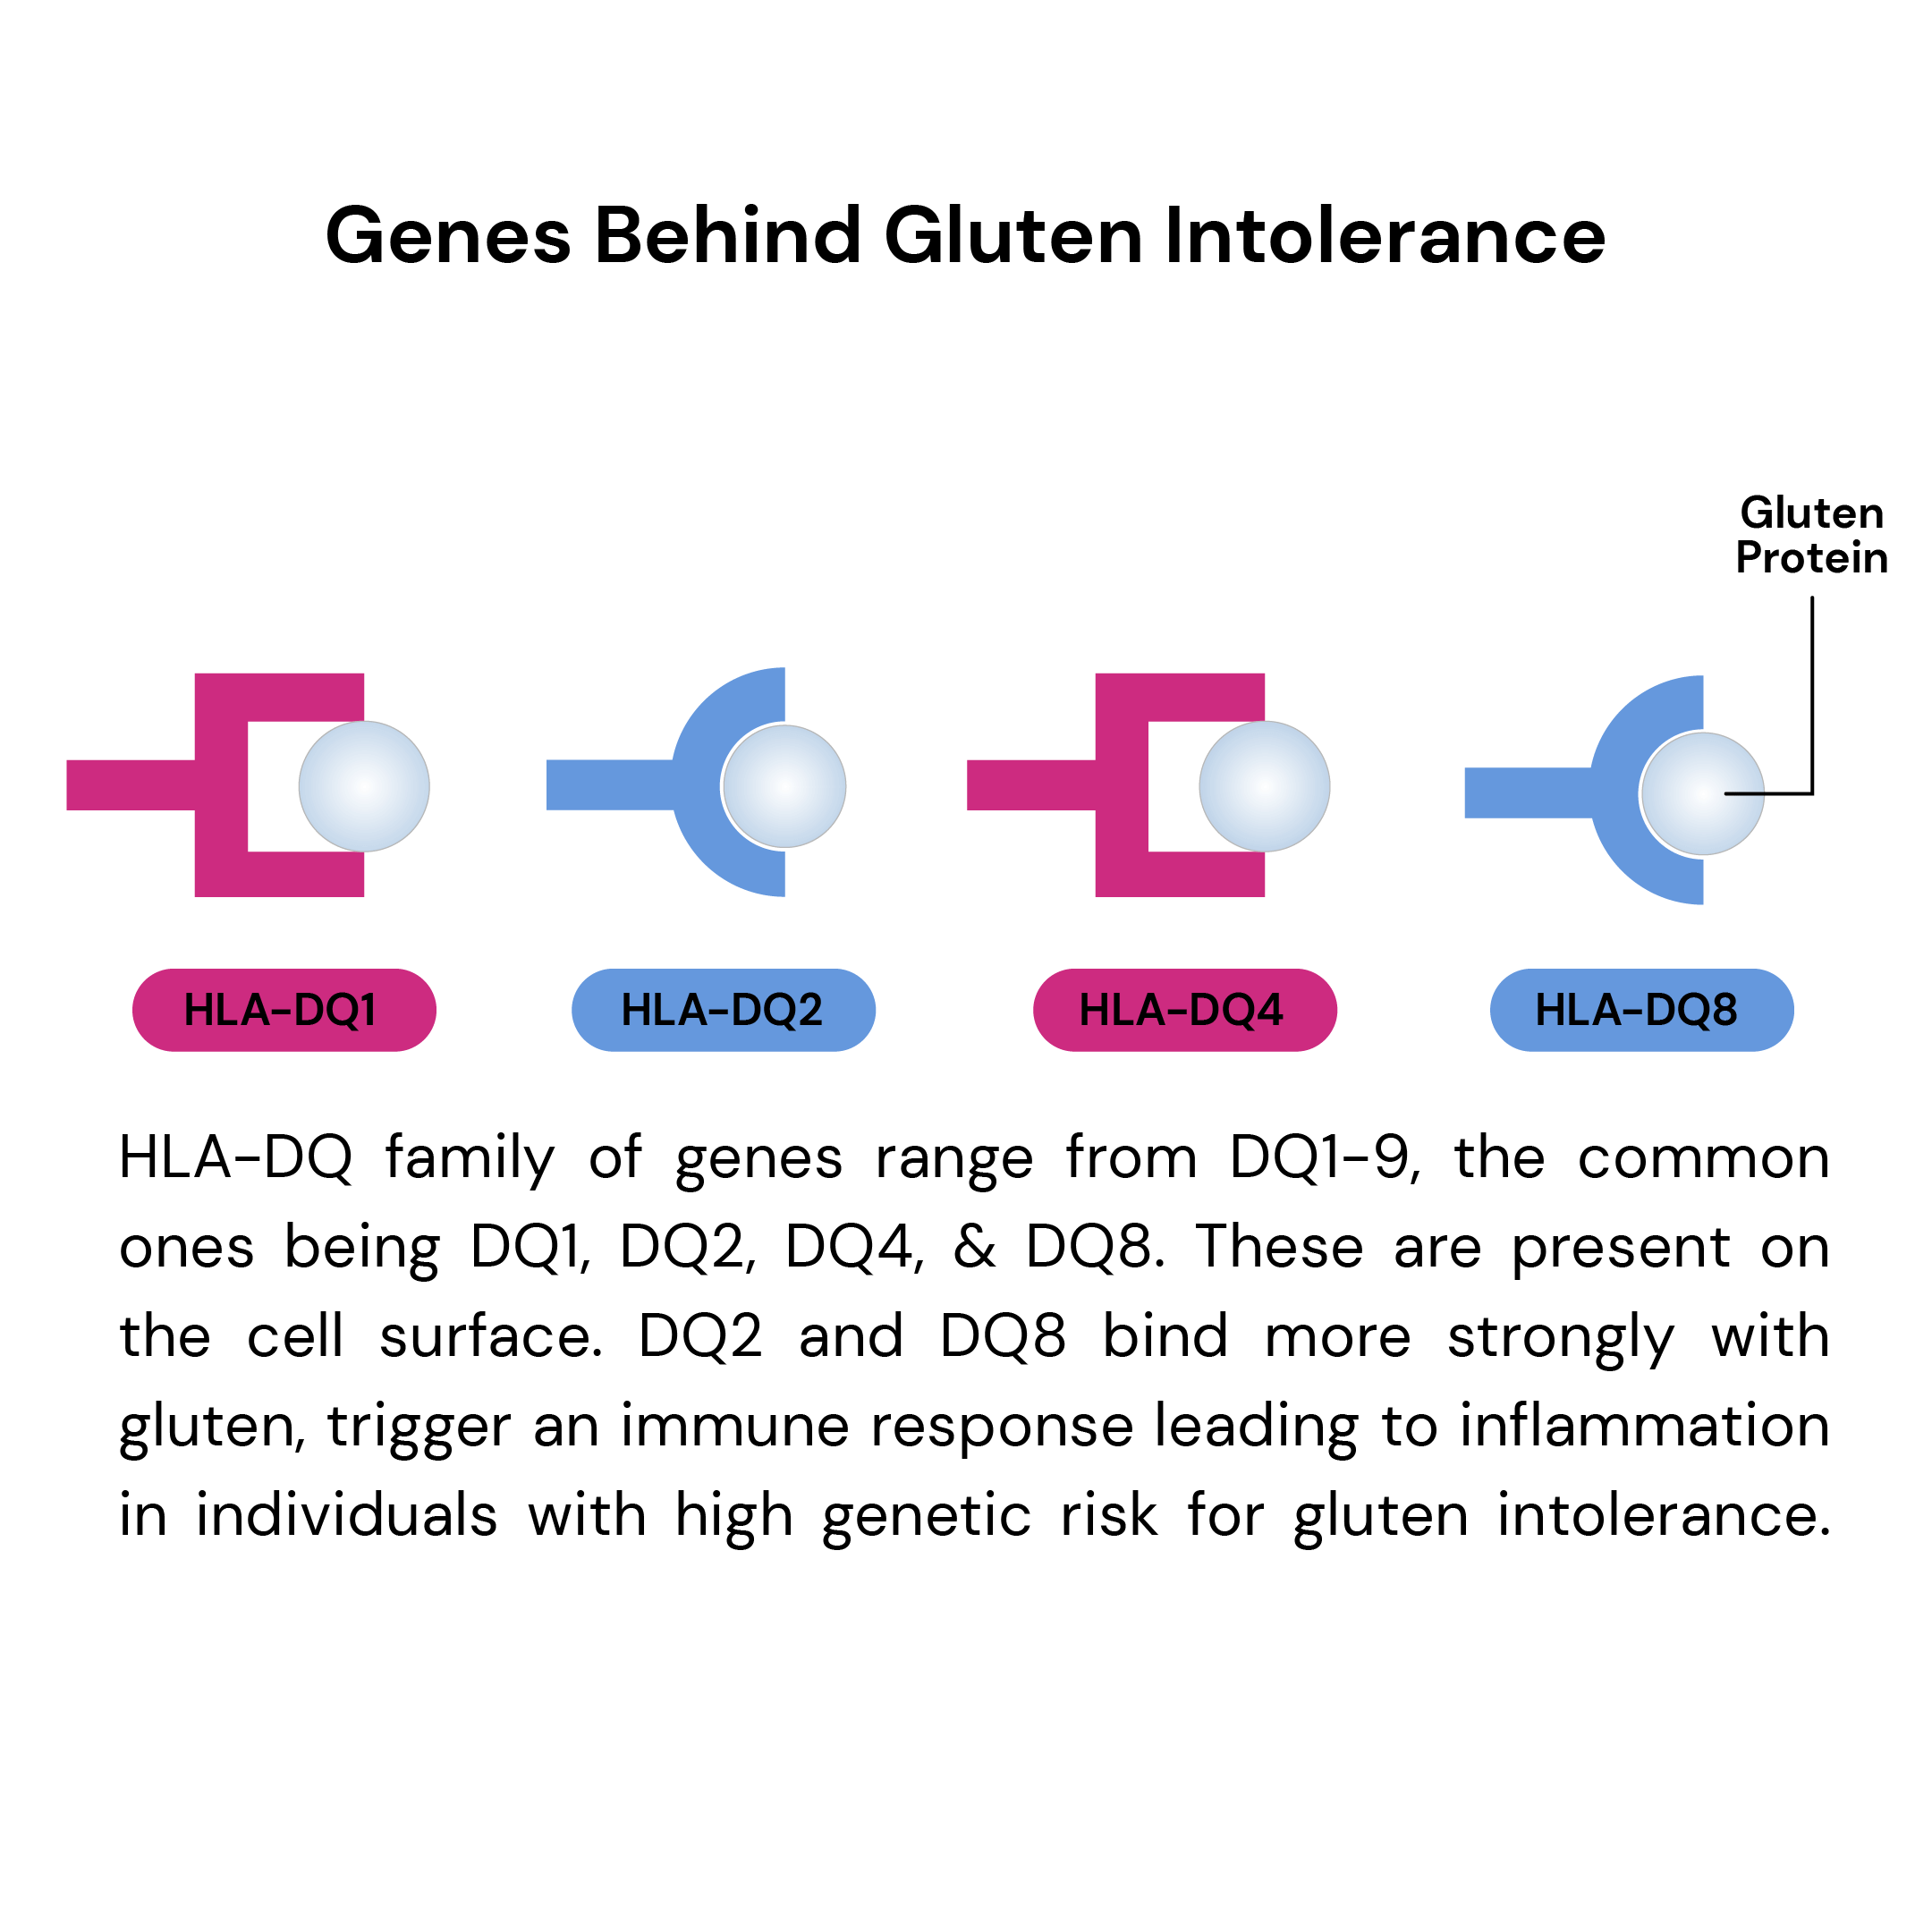
The genetic basis lies primarily in variations of the HLA-DQ gene (HLA stands for human leukocyte antigen), which individuals inherit from both parents.
Specific combinations of HLA-DQ genes, particularly HLA-DQ2 and HLA-DQ8, significantly increase the risk of developing gluten sensitivity.
Gluten exposure in sensitive individuals can cause a wide range of effects. These can be as mild as slight stomach discomfort or as serious as damage to the intestines.
When the intestines are damaged, the body may have trouble absorbing essential nutrients from food. This can lead to various health problems over time.
The severity of the condition depends on both genetic factors and gluten intake.
Dietary management is crucial for those with pronounced gluten sensitivity, especially celiac disease.
Eliminating gluten from the diet is often the most effective approach to prevent symptoms and avoid long-term health complications.
Gluten sensitivity is linked to certain genetic markers, though the connection is less clear than with celiac disease.
Research by Dr. Alessio Fasano from the University of Maryland found that only 56% of those with gluten sensitivity carry the HLA-DQ2 or HLA-DQ8 genes.
These genes are strongly associated with celiac disease, suggesting that while they may play a role, they are not the primary cause of gluten sensitivity.
Another study by Dr. Kenneth Fine, developer of EnteroLab testing, suggests genes like HLA-DQ1 and HLA-DQ3 might also contribute to gluten sensitivity.
He believes that only a small fraction of the population lacks the genetic potential for gluten sensitivity.
However, further research has yet to accept or validate these findings widely.
Yes, there is a gluten sensitivity gene with certain variants that are more influential:
Gluten gene mutations like HLA-DQ2 or HLA-DQ8 increase the risk of developing gluten sensitivity, but their presence doesn't definitively predict the condition.
While strongly associated with the condition, not everyone with these mutations experiences symptoms.
Gluten sensitivity can also occur in individuals without these specific genetic markers, indicating that other factors contribute to its development.
Not everyone carries the HLA-DQ8 gene.
According to studies, approximately 30%-40% of the general population has either the HLA-DQ2 or HLA-DQ8 genes without developing celiac disease.
Among those with celiac disease, about 95% express the HLA-DQ2 gene, while the remaining 5% typically have the HLA-DQ8 gene variant.
If you have done an ancestry genetic test with companies like 23andMe, AncestryDNA, MyHeritage, etc., you can download your raw DNA data, order the Gene Nutrition test, and upload your file for analysis.
While genetics play a significant role in gluten sensitivity, other factors can also affect its development and severity. These include:
It's important to note that while these factors can contribute to gluten sensitivity, ongoing research is working to understand their specific roles better.
At present, no diagnostic procedure exists specifically for gluten sensitivity. The gluten intolerance gene test is more precisely a genetic risk assessment for celiac disease.
This test examines DNA for specific gene variants, especially in the HLA-DQ complex, associated with an increased risk of developing gluten intolerance.
Individuals suspecting gluten intolerance can use the test to evaluate their genetic risk before changing their diet or seeking medical advice.
Being positive for DQ8 means carrying the HLA-DQ8 gene, which is part of the HLA gene complex.
This gene variant is linked to a higher risk of gluten sensitivity and celiac disease.
While having the DQ8 gene does not guarantee that you will develop these conditions, it does indicate a higher genetic predisposition.
The presence of DQ8 suggests that your immune system might react adversely to gluten, potentially leading to intestinal damage if celiac disease develops.
Testing positive for DQ8 can help in diagnosing celiac disease, especially when combined with other medical tests and symptoms.

Gluten-Free Good For You? Analyze Your DNA Raw Data Now!

How Genes Influence Your Risk For Lactose Intolerance
https://my.clevelandclinic.org/health/diseases/21622-gluten-intolerance
https://celiac.org/about-celiac-disease/what-is-celiac-disease
https://www.mayoclinic.org/diseases-conditions/wheat-allergy/symptoms-causes/syc-20378897
https://pubmed.ncbi.nlm.nih.gov/11892082
https://www.ncbi.nlm.nih.gov/pmc/articles/PMC3641836
https://www.ncbi.nlm.nih.gov/pmc/articles/PMC6502200
https://www.ncbi.nlm.nih.gov/pmc/articles/PMC10096482
https://my.clevelandclinic.org/health/diseases/21622-gluten-intolerance
https://www.verywellhealth.com/gluten-sensitivity-genes-562967
https://www.verywellhealth.com/hla-dq8-one-of-the-main-celiac-disease-genes-562571